


It’s Elementary. The Setup for the Rally was Reliable. What’s Next is More Important.
Time is ticking. How to gauge whether the rally has legs.

Sherlock Holmes might describe the technical setup which preceded this rally as “elementary, dear Watson.” Yet, even though the present shows promise, it’s what the future holds which matters most to investors. So, while stocks are back in rally mode in the short term; perhaps longer, there are no certainties. Yet, the longer they hold up, the more likely will be the odds that we may have seen the worst.
Last week I noted that the prior Friday’s action seemed like a washout; a notion that so far has held up. The conclusion was partially built on the rising wall of worry expressed by many pros while the CNN Greed/Fear Index hovered near Extreme Panic readings. Meanwhile, the market’s breadth was tracing a bullish divergence pattern even as the major indexes floundered. That’s a classic panic bottom scenario which so far is unfolding according to the script.
So, are we out of the woods? The truth is, only time will tell. Thus, the best any of us can hope for is that, as time passes, at the end of each trading day we’re better off than we were on the prior day and that the next day follows along the same route.

Image courtesy of flubu.com.
The Setup Was Reliable. What’s Next is More Important.
Even if this reversal eventually fails, the setup that preceded was reliable. Indeed, the current situation resembles similar periods in the past where the combination of extreme bearish sentiment in the face of a rebound in the market’s breadth clearly pointed out a bullish turning point. Moreover, there was steady evidence that somebody was quietly buying the dip every time the market sells off.
What’s more important is what the indicators suggest is next:
• The CNN Greed/Fear Index (GF) clocked in as low as 27 at is worst. As of 1/17/25, it climbed to 38, a fearful but not extremely fearful reading. For this rally to last, we need to see a slow burn of fear.
• The Put/Call ratio fell to 0.7 after reaching its recent highs just above 1.0 in early 2025. The prior meaningful market bottoms, which led to long term rallies followed P/C ratios of 1.25 (8/24) and 1.30 (11/24). As with the GF index, a slow descent in this ratio offers the rally durability.
• The S&P 500 (SPX) and the Nasdaq 100 (NDX) are back above their 50-day moving averages. Keeping an eye on their RSI and the 70 level will help us gauge the future.
• The New York Stock Exchange Advance Decline line (NYAD, see below for full details) has moved back above its 50-day moving average. The rally will be helped if NYAD can make a series of new highs in the next few weeks. A failure of this to happen would be negative.
Bottom line: The rally was in the cards. Now we have to see if has legs beyond the short term.
Bond Market Favorable for Now.
Aside from the internal indicators and the overwhelming bearish climate described above, the stock market’s reversal has been fueled by a reprieve of the recent interest climb witnessed in the bond market.
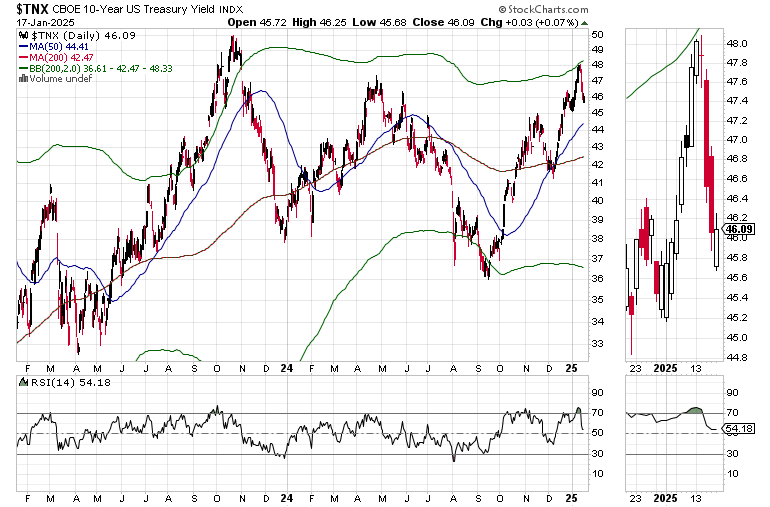
I was not surprised to see the reversal in bond yields last week as the U.S. Ten Year Note yield (TNX) was nearing a level which was unsustainable given normal trading parameters. I discussed this in detail here last week. Yet, as with stocks, what’s most important is what TNX does next.
A reprise of last week’s chart shows that TNX reversed as it tagged the upper Bollinger Band related to the 200-day moving average, a very meaningful event which signals a possible retracement all the way back to the 200-day line which is 4.25%. First, however, it has to fall below the 50-day moving average.
Thus, if TNX breaks below the 50-day, we will likely see a test of the 200-day line. A move below the 50-day will likely spur stock prices higher. What happens at the 200 will mark what happens for several months.
Interest Rate Sensitive Sectors Offer Clues
The price action in interest rate sensitive sectors is crucial to the wellness of the market. When these sectors rally, it often signals a benign interest rate environment. There are three to keep an eye one.

First are the utilities, as in the Utilities Select Sector SPDR ETF (XLU). You can see that XLU toppled when bond yields began their recent climb, back in December 2024. Now, as bond yields have eased, XLU has recovered, climbing back above its 50-day MA.
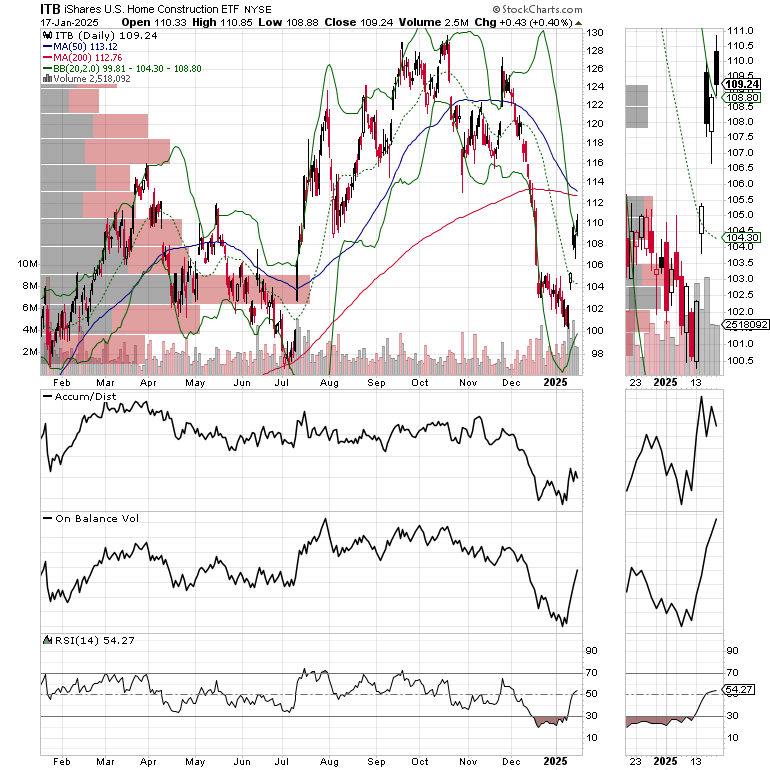
Next, the housing sector as in the iShares U.S. Home Construction ETF (ITB). This sector topped out back in October 2023 when TNX reversed its decline. This means that housing has become more interest rate sensitive than the utilities. Thus, what happens with ITB will likely be a better indicator of what happens with interest rates in the future.
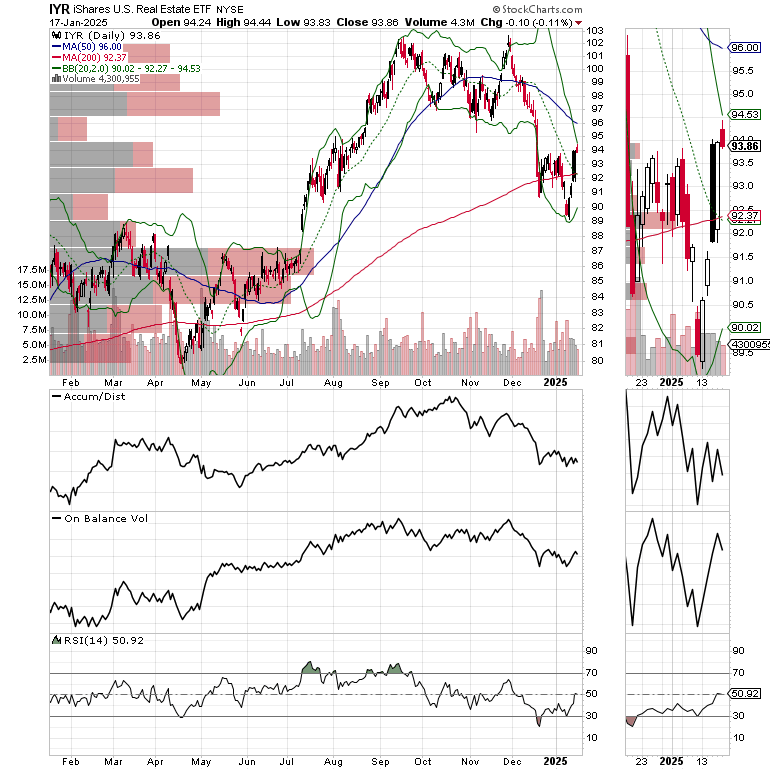
The iShares U.S. Real Estate ETF has crossed back above its 200-day moving average, a bullish development, especially if it holds. The next test is the 50-day moving average.
I’ve been adding housing stocks cautiously to both my long term focused Weekender Portfolio, and the more aggressive short term oriented Smart Money Passport lately. In addition, I’m adding new picks in other sector in both portfolios as the rally broadens.
Liquidity Turns Bullish
Liquidity, the ease with which money travels through the financial system is the key to bull and bear markets. When liquidity is ample, markets tend to rise. When liquidity is scarce markets don’t do well. The Federal Reserve’s National Financial Conditions Index (NFCI) is a readily available tool which indirectly shows us the state of liquidity in the markets.
A decline in the weekly NFCI number indicates that the ease with which money can be borrowed is rising. Last week, NFCI decreased more aggressively. Thus, it’s no accident that stock prices rebounded.
A further drop in NFCI would be a signal that liquidity is increasing and that conditions for buying stocks are improving.
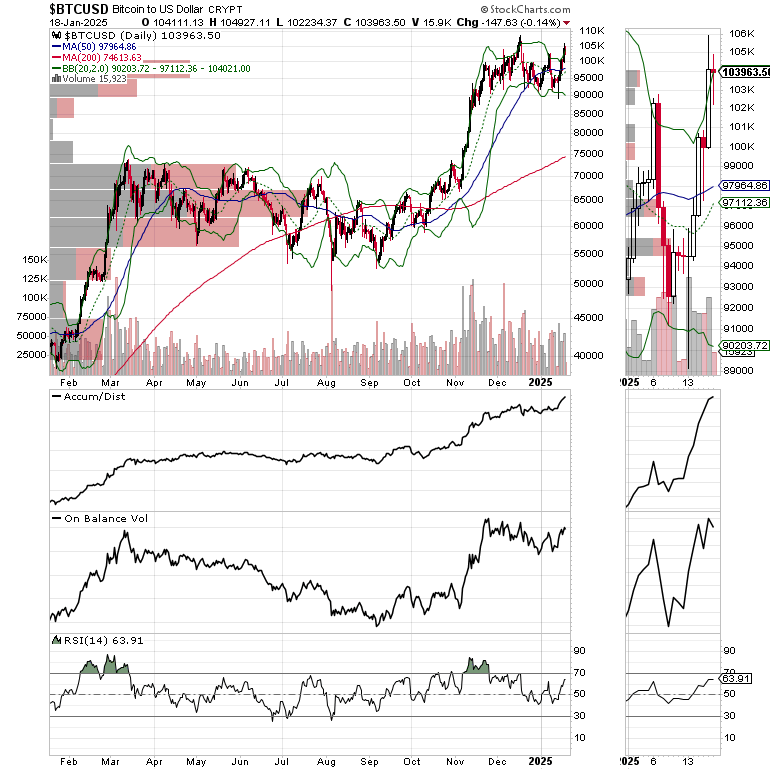
Bitcoin Nears Breakout Again
Bitcoin (BTCUSD) is on the verge of a major breakout with the $100,000 level now becoming short term support.
You can check out my latest Bitcoin trade at the Smart Money Passport. If you’re an ETF trader, consider, Joe Duarte’s Sector Selector. It’s FREE with your monthly membership to Buy Me a Coffee. Sign up here. If you’ve been thinking about starting a day trading career, my new book “Day Trading 101” will get you started on the right foot. For steady gainers, check out the Smart Money Weekender Portfolio. I’ve just added several new positions in this weekend’s edition. Start the year on a healthy note with my Health Page.

The New York Stock Exchange Advance Decline line (NYAD) is just below its 50-day moving average. This is encouraging but we need to see a continuation of the upside action and new highs within the next couple of weeks or the odds of the rally failing will rise.

The Nasdaq 100 Index (NDX) is back above its 50-day moving average but ended the week inside the 21,000-21,250 trading range. Neither the ADI or OBV lines are very compelling currently.

The S&P 500 (SPX) also recovered but failed to close above the 6000 level. The 50-day moving average is now support.

VIX Falls Well Below 20
The CBOE Volatility Index (VIX), is rolling over easing some of the pressure on stocks.
VIX rises when traders buy large volumes of put options. Rising put option volume leads market makers to sell stock index futures to hedge their risk and leads markets lower. A fall in VIX is bullish signaling lower put option volume, eventually leads to call buying which is bullish as it causes market makers to buy stock index futures raising the odds of higher stock prices.
To get the latest up to date information on options trading, check out “Options Trading for Dummies”, now in its 4th Edition – Available Now!
#1 Best Seller in Options Trading – Now in Audible Audiobook Format

Options Trading for Dummies (4th Edition) Audible Audiobook – Unabridged
Joe Duarte MD (Author), Terrence Kidd (Narrator), Tantor Audio (Publisher)
4.5 out of 5 stars
#1 Best Seller in Options Trading