


The Bitcoin Effect is Affecting Stocks. Wall Street Need a Shot of Caffeine.
The Stock Market is Acting as if it was August, not December.

The last time I checked, we’re in December. It’s supposed to be “the most wonderful time of the year.” Yet, the stock market is acting as if we were in the dog days of August. It’s possible that Bitcoin has something to do with it.

Stock traders may need a really good shot of espresso to get things moving. Image courtesy of lovethispic.com
I’m Scratching My Head – Is this Time Different?
The stock market has been playing hide n’ seek, an unusual development in December, when stocks tend to move higher. But this time may be different. As I discuss below, the developing breakout in Bitcoin could well be a deciding factor affecting stocks.
It may be too early to close the door on the Santa Claus rally. Certainly, the stock market has a lot of digesting to do after a winning 2024, especially when the last few months have been rather busy on multiple non-market fronts. Yet, this December feels a bit different. Of course, if the upcoming CPI release comes in under the expected 2.7% headline and 3.3% core, we may see higher stock prices as the odds of a Fed rate cut on 12/18/24 will likely increase.
Don’t get me wrong, I’m not bearish; at least not yet. It just seems as if the stock market is running in place, which goes against the usual end of the year trading pattern, especially during a period when the Fed is easing monetary policy.
So, while the indexes continue to make new highs, most of the market (see data on NYAD below) is going nowhere. Instead of steady advances and limited pullbacks, the algos are buying early in the day but fading the market as the trading session progresses. That means that the order flow, which feeds the trend, is inconsistent. In other words, the buyers don’t hang around for the entire trading day and volume is lackluster, which makes the HFT/market makers bring down bids to pull in buyers. When no buyers materialize, the bids get pulled lower. Eventually what started as good day tanks.
In other words, it’s a bit difficult to reconcile the lackluster market breadth when there’s plenty of excess money in the system (See NFCI summary below).
Yet, the longer this trading pattern remains in place, the more the odds will rise that the market makers will start to buy puts in order to protect their own accounts. When they do, the trading crowd will notice and buy puts to protect their own accounts. Put buying causes a rise in VIX. A rise in VIX causes people to get concerned. And eventually a market top forms.
Let’s hope it doesn’t go that far anytime soon.
Liquidity Continues to Rise
The National Financial Conditions Index (NFCI) continues to fall clocking in at another reading of - 0.64. This is bullish because the lower the number goes, the higher the liquidity level in the financial system. But stocks are barely budging, which means the liquidity is going elsewhere.
Ten Year Note Breaks Below 4.3%. Will We Get to 4%?
One place liquidity is flowing is the bond market as bond traders have found a reason to buy. I’m not sure what it is they’re seeing though as the economic data is middling but not collapsing. Yet, the U.S. Ten Year Note Yield (TNX) fell below 4.3% below its 200-day moving average, possibly headed for a test of 4%. TNX is getting extended, though (RSI near 30), thus a counter trend move can start any time.

Mortgage rates are, as usual, following TNX. As I explain in detail here, this sudden drop in bond yields and the subsequent decline in mortgage rates should be spurring homebuilder stocks higher.
Yet, the iShares U.S. Home Construction ETF (ITB) is ignoring these bullish developments in interest rates. All of which brings me to ask the burning and increasingly burning question: how many Bitcoins does it take to buy a house? If you’re not getting my FREE weekly real estate and interest rate updates, you can sign up here.

The Bitcoin Effect: Is Bitcoin Sucking Up the Liquidity? It’s a Thing.
So where is all the money that’s not going into stocks being funneled? Aside from bonds, it’s all about Bitcoin, which is straddling the $100,000 mark with wild price swings and lots of hoopla. So, is this a bad thing for stocks? It’s hard to tell right now. All I can say is that it’s a thing. No. I’m not a Bitcoin hater. Yes, I have some money in Bitcoin.
A picture is indeed worth 1000 words. The chart below suggests that the stock market’s recent meandering may well be related to Bitcoin’s allure. I use the New York Stock Exchange A-D Line (NYAD) as a proxy for the stock market. When NYAD rises it’s a sign that more stocks are in uptrends than those in downtrends. For the early part of 2024, both Bitcoin and NYAD were closely correlated. Lately, the relationship between NYAD and BTC has changed.
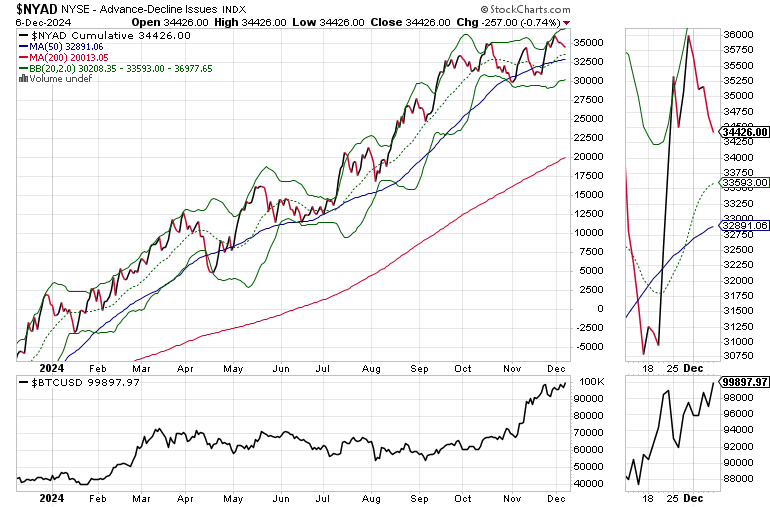
Prior to March, 2024 both NYAD and BTC were closely correlated. But in March, a divergence began to develop with BTC moving sideways while NYAD continued its climb. However, in October, as BTC began its climb, NYAD began to consolidate.
More recently, Bitcoin’s burgeoning breakout is closely aligned with the lackluster action in stocks. You be the judge. But based on this graphic, Bitcoin seems to be attracting money that might otherwise find itself going into stocks.
Retail Breaks Out
We seem to have a situation in the retailing sector as the VanEck Vectors Retail ETF (RTH) is channeling Bitcoin these days.

Of course, ‘tis the season for the sector. But inside the ETF, the big winners are Amazon.com (AMZN) and Walmart (WMT), both current holdings of the Smart Money Passport Weekender Portfolio.

Amazon has proven to be a reliable buy on the dip candidate with the 20-day moving average providing consistent opportunities to enter the shares. It’s well due for a consolidation, which until proven otherwise will offer yet another BTFD opportunity.

Walmart is also overdue for a pullback. The stock has accelerated its advance over the last month and is very overbought with the RSI well into the overbought range.
If you’re an ETF trader, consider, Joe Duarte’s Sector Selector. It’s FREE with your monthly membership to Buy Me a Coffee. Sign up here. If you’ve been thinking about starting a day trading career, my new book “Day Trading 101” will get you started on the right foot. For short term intermediate momentum, and frequent option trades, visit the Smart Money Passport.

Breadth Divergence Develops. NYAD Pulls Back as SPX and NDX Climb.
The New York Stock Exchange Advance Decline line (NYAD) recently made a new high, but the joy was short lived. Certainly, NYAD is not breaking down. But it’s not keeping up, or leading the major indexes, which means that a technical divergence is developing.

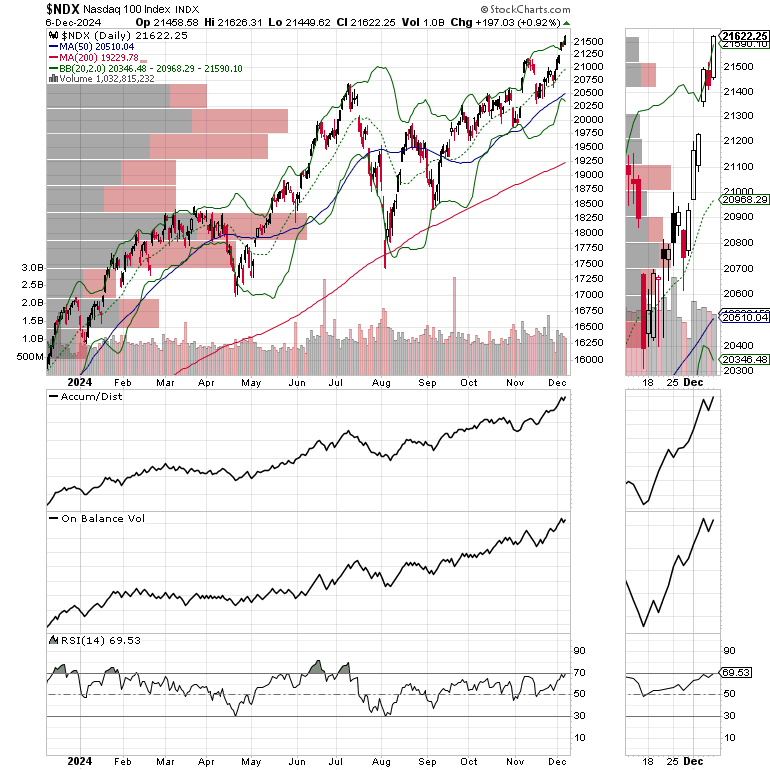
The Nasdaq 100 Index (NDX) made a new high last week. Support is now at 21,000-21,250.
The S&P 500 (SPX) is putting more distance between itself and the 6000 level. The 20-day moving average is support near 5900.

The CBOE Volatility Index (VIX), remains below 20 which is a bit of a positive divergence given the recent reversal in stocks.
VIX rises when traders buy large volumes of put options. Rising put option volume leads market makers to sell stock index futures to hedge their risk and leads markets lower. A fall in VIX is bullish signaling lower put option volume, eventually leads to call buying which is bullish as it causes market makers to buy stock index futures raising the odds of higher stock prices.
To get the latest up to date information on options trading, check out “Options Trading for Dummies”, now in its 4th Edition – Available Now!

#1 Best Seller in Options Trading – Now in Audible Audiobook Format
Options Trading for Dummies (4th Edition) Audible Audiobook – Unabridged
Joe Duarte MD (Author), Terrence Kidd (Narrator), Tantor Audio (Publisher)
#1 Best Seller in Options Trading