Sell in May and Go Away Gets Rude Welcome. Why Price Charts and Detailed Market Analysis are the Way to Go.
Do you want to be right? Or do you want to make money?
Old traders on Wall Street would often ask: Do you want to be right? Or do you want to make money? Those words remain as viable today as ever, as the market’s breadth is back in an intermediate term uptrend while the major indexes are catching up. That means money is moving into stocks. To be a successful trader you must follow the money.
Image courtesy of wallpaperaccess.com.
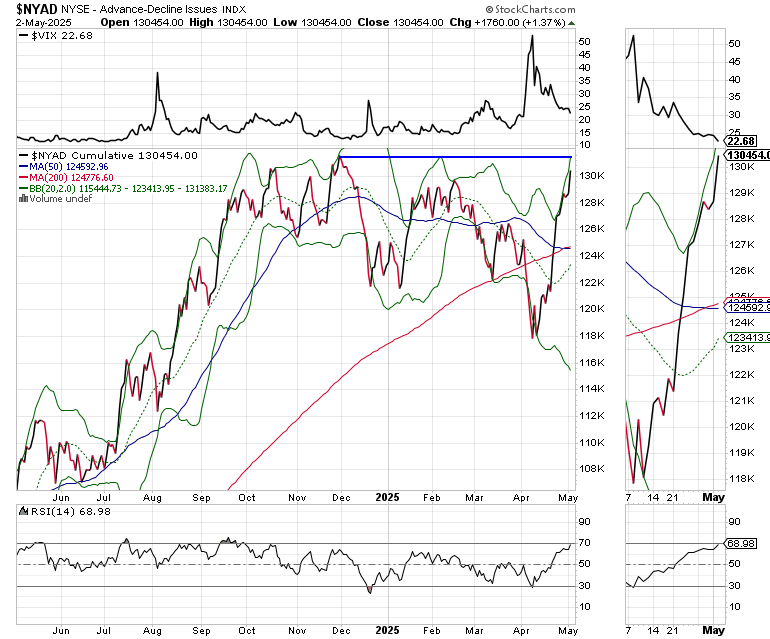
The old Wall Street meme, “Sell in May and Go away” may start anytime. But it surely didn’t start last week as the New York Stock Exchange Advance Decline line (NYAD) delivered a marginal new high, suggesting that the bearish trend is in doubt. We still need confirmation from the indexes, and it would be helpful if the Fed eased or if we got some good news on the tariff front or on any of the other persistently worrisome issues which continue to swirl around the markets. Nevertheless, the wall of worry doesn’t seem to want to break down rapidly, which is a bullish development for contrarian investors.
Sell in May and Go Away is the antithesis of the Santa Claus rally. Both are based on seasonality patterns, which most traders would vouch for. But should they? According to data from tradethatswing.com, there is some variability in monthly performance in the NYSE Composite (COMP), the S&P 500 (SPX), and the Nasdaq 100 (NDX). May is weak for the NYSE, but not for SPX or NDX. Moreover, November is bullish for all three, but isn’t that before Santa saddles up? Where all three indexes agree is in the month of July as being the best month of the year, and the month of September being a very bad month.
So yeah, the market will fluctuate.
If you’re looking for a reason as to why seasonality is less reliable now than in the past, look to the algos. They don’t celebrate Hannukah, Christmas, Memorial Day, the 4th of July, or Labor Day, which are the traditional Wall Street seasonality benchmarks. They just gauge the order flow. When the money is coming in, they buy. When money flows reverse, they sell. They don’t ask questions. They don’t look for reasons to stay with losers. And they don’t care what happens as long as they follow their trading instructions.
What’s my point? Seasonality can be useful in a remote macro way. But paying close attention to the market’s breadth, sentiment, liquidity and detailed attention to price charts are much better tools for trading than trendy memes such as “Sell in May and Go Away.” That’s because the market’s breadth, sentiment, liquidity, and detailed attention to price charts provide glimpses as to the direction and specific targets where the money is flowing and by default what the algos are doing. Like it or not, that’s the key to success in the current market – following the algos. Indeed, if you sold in May and went away, you might miss the best month of the year by many accounts, which is July.
A perfect example of the thesis described above is the current market where everyone is bearish, the news is grim, and panic is raging. Yet, over the last couple of weeks, starting on April 22, as I’ve noted the market’s breadth improved, signaling that money was moving back into stocks and that the algos had once again become net buyers.
Can it all turn south tomorrow? Of course. But the algos wouldn’t care, they would just sell stocks and short the market. How will we know what they’re doing? Watch NYAD and key price charts. That’s what I’ll be doing.
Money Scampers into Evolving Growth Sectors
When investing, there is no substitute for following the money. And money is moving rapidly back into non traditional growth areas of the market. Thus, even though technology is still a fertile growth area, and money will continue to flow to the semiconductor companies, a new wrinkle is becoming evident as more companies are ramping up their return to the U.S. with their entire business platforms ranging from storage to servicing, to manufacturing. We saw this, to some degree, after the pandemic where warehouses popped up everywhere as supply chains shifted. What’s different this time, is that it’s not just warehouses that are being built, it’s plants and their power and electric grid infrastructure in order to operate them. Therefore, many industrial sectors are transitioning from their traditional cyclical behavior toward one where they are being perceived as sectors with growth potential.
You can see that in the S&P 500 Citigroup Pure Growth Index (SPXPG), which has, in less than a month retraced about ½ of its recent losses and has crossed back above its 200-day moving average.
And while the usual suspects in technology have seen a bounce, perhaps the most interesting rebound may be the industrial stocks, as in the Industrial Select Sector SPDR (XLI), which has also crossed back into bull market territory by climbing above its 200-day moving average. That’s because the market is realizing that infrastructure and financing will be in high demand once the tariff related deals get closed and more companies move their businesses to the U.S.
Inside the industrial sector, we’ve seen big money move into the electrical grid infrastructure and related companies as in the First Trust Nasdaq Clean Edge Smart Grid Infrastructure Index Fund (GRID), which looks set to move decidedly higher.
Even more compelling is the action in the Financial Select Sector SPDR Fund (XLF), which houses banks, insurance companies and brokers. Again, building new factories and expanding storage and servicing areas will require financing and risk management. We’ve been adding insurance and brokerage and related financial services stocks, along with grid related stocks to our Momentum Monday portfolio, with good results over the last few weeks.
Liquidity Watch - Conditions Continue to Tighten.
The Fed better hurry as liquidity is steadily tightening. The latest reading, April 18, 2025, of the Fed’s National Financial Conditions Index (NFCI) came in at -0.45 holding steady but still displaying much tighter conditions than we’ve seen in the last two months. Negative numbers signify ample liquidity. Yet, the nearly 10-plus basis point rise over four weeks is cautionary and at least partially explains the general weakness in stocks.
Sentiment Summary – Options Market Hits Fear Button
The CNN Greed/Fear Index (GFI) closed last week at 43, registering Fear. It’s well off the low reading for the cycle of 4, but remains bullish because even though the market is rallying, there is still plenty of fear in the air.
The Composite Put/Call Ratio closed at a moderately bullish 0.89. But the index P/C ratio closed at 1.48, a very bullish reading. This remains constructive as the bears don’t want to believe.
The CBOE Volatility Index (VIX) closed at 22.68 after rising above 50 at its worst level of the decline. The reversal in VIX has, as it often does, coincided with an improvement in the market.
The S&P 500 (SPX) is closing in on 5750. A sustained move above this level will be a big positive. Here is some useful background to help you sort out this important price level.
The bond market has calmed down but remains a wildcard.
Bond Yields Hold Steady
The bond market remains calm as inflation may be cooling off. Moreover, the jobs market has yet to show significant weakness as it transitions toward the new normal of fewer foreign workers and more domestic workers.
The U.S. Ten Year Note yield (TNX) is still hovering near 4.3% with the 200-day moving average proving to be stubborn support.
If you’re an ETF trader, consider, Joe Duarte’s Sector Selector. It’s FREE with your monthly membership to Buy Me a Coffee. Sign up here. If you’ve been thinking about starting a day trading career, my new book “Day Trading 101” will get you started on the right foot. For steady gainers, check out the Smart Money Weekender Portfolio. I’ve just added several new positions in this weekend’s edition. Trade better with extra energy, and vitality. Visit my Health Page.
NYAD Gives All-Clear with New Highs. Nasdaq 100 Closes in on Confirmation.
The New York Stock Exchange Advance Decline line (NYAD) delivered a new high on 5/2/25, signaling that at least the intermediate term uptrend has returned. We may see a short term consolidation before NYAD extends its current bullish tone.
The Nasdaq 100 Index (NDX) is closing in on its 200-day moving average. A successful move above this critical technical level would confirm the positive tone of the NYAD
The S&P 500 (SPX) is testing the 5750 resistance level. If events continue on their current path, we should see a bullish confirmation here as well.
VIX Heads for Test of 20
The CBOE Volatility Index (VIX) continues to fall as volatility decreases. A move below 20 would indicate that the uptrend could last.
VIX rises when traders buy large volumes of put options. Rising put option volume leads market makers to sell stock index futures to hedge their risk and leads markets lower. A fall in VIX is bullish signaling lower put option volume, eventually leads to call buying which is bullish as it causes market makers to buy stock index futures raising the odds of higher stock prices.
To get the latest up to date information on options trading, check out “Options Trading for Dummies”, now in its 4th Edition – Available Now!
#1 Best Seller in Options Trading – Now in Audible Audiobook Format
Options Trading for Dummies (4th Edition) Audible Audiobook – Unabridged
Joe Duarte MD (Author), Terrence Kidd (Narrator), Tantor Audio (Publisher)


