


Momentum Run Kicks Off. Wall Street Jumps for Joy. Stocks Explode. Bond Yields Crack. Think -Liquidity.
The Trend is Up. But Bumpy Ride Dynamics Persist. Trade the market, not the headlines.


Image courtesy of storyblocks.com
The stock market finally broke out to a new set of highs on everything as both the New York Stock Exchange Advance Decline line (NYAD) and the major market indexes broke out decisively while bond yields crashed below their recent lows. That’s a bullish turn on all sides. Moreover, it signals that we are entering an important stage in what could be a fast and furious momentum rally.
The Two Sides of Momentum
Certainly, momentum rallies are profitable, but they do have a downside; they always end on a sour note, which means that our goal is to ride the uptrend aggressively, while staying alert for signs that the momentum is waning. As things stand, this momentum run is probably in the middle stages as the market has rebounded aggressively since the April lows.
A perfect example of how quickly things can turn was the tariff tantrum that developed mid-day on Friday, as the White House announced it was ending trade talks with Canada and stocks gave back a portion of their gains with the technology sector taking the brunt of the hit. We’ll see if it sticks and who blinks first. On the other hand, the dip buyers once again materialized and stocks ended up on the day, although off their best levels.
We are well positioned in both the Smart Money Passport and the Weekender Portfolio and I am now trading the long side, but remain on high alert for any signs that the trend is changing. The bottom line is that we will enjoy the ride, but we won’t mind getting off the train a little early once we see the signs that the tracks are getting bumpy.
What’s Driving the Market? Liquidity. Liquidity. Liquidity.
Last week, I noted that comments by Fed governor Waller, suggesting that he was for a rate cut “as early as July” would likely ignite some pent up bullishness in stock traders. And as the new highs, achieved on Friday illustrate, I was right. Don’t misunderstand me. I’m not taking a victory lap. In fact, I’m becoming more aware of my market surroundings.
That’s because I’ve been constructive on stocks since May and we’ve had some great results since then. Most recently, we took $2400 in profits on AMD, on top of an $825 profit on RTX before the Middle East cooled off. That said, I’m still trading this market actively based on my easy to follow trading plan:
Always be ready for a big move – up or down;
Stay calm and focused;
Follow the status of the market’s liquidity closely (see below for details on the NFCI);
Keep abreast of the market’s sentiment (see below for details);
Monitor each portfolio position individually;
Consider taking profits on positions that are extended and thus vulnerable to profit taking;
If a position is stopped out, move on;
If a position is not stopped out, keep it in the portfolio; and
Always have a shopping list ready to deploy.
In addition to Waller’s pronouncements followed by positive comments by Fed governor Bowman and dovish talk from Chicago Fed President Goolsby, the market was ripe for bullish news, which came in the form a flat PCE suggesting that the rate of rise in inflation is slowing and thus the Fed may have room for a rate cut in July. Furthermore, the system’s liquidity remains stable because of the Fed’s back door easing and the Treasury’s stealth maneuvers which are steadily providing funds for the banking system.
Show me the Money
There are three important sectors to monitor as the current situation unfolds.

As always, our first look is at the semiconductor sector due to the dominant role it has in AI and its offshoots. Last week, we saw the semiconductor sector (SMH) make a series of new highs, although it looked a bit tired by week’s end. I recently recommended a semiconductor stock at the Smart Money Passport, and the stock is moving steadily higher, and not looking tired.

Surprisingly, the defense and aerospace sector (PPA) got a nice boost even after the Middle East cooled off. Some of that may be due to the expectations of higher defense spending coming out of Washington as well an on the effect of sales of fighter planes to U.S. Allies. PPA is a current holding in Sector Selector Portfolio, which can be a useful addition to your retirement investment research for your 401 (k) or self-directed IRA.
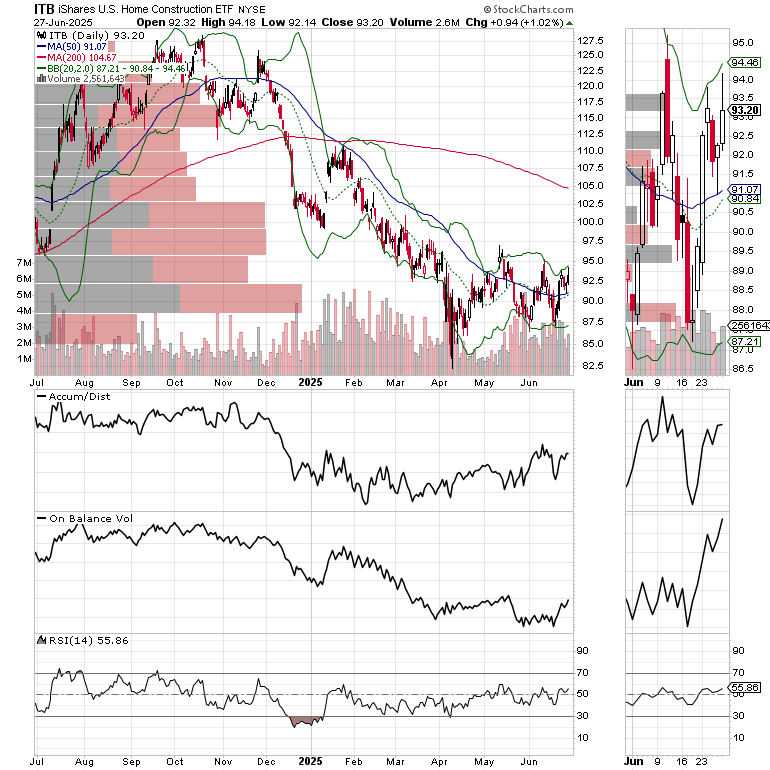
In addition, I’m keeping a close eye on the homebuilders (ITB) as low bond yields will eventually lower mortgage rates. Interestingly, I’m starting to see new homes that have been sitting on the market for the past eight months being purchased. This is likely to be boosted if mortgage rates stay lower than they’ve been for a while, especially if the Fed lowers rates in July and the bond market likes the inflation outlook.
We’ve patiently held several homebuilders in our Weekender Rainy Day Portfolio and they are all starting to move. It could still be slow going for a while, but until proven otherwise, the bottom for the homebuilders is now in place.
Bottom line – Liquidity is the key for the market’s trend
Liquidity, as I discuss in detail remains plentiful although the rate of climb seems to have flattened out. That may be a positive in disguise as it would give the Fed a reason to cut rates and once again prime the pump.
Liquidity Watch – Financial Conditions Remain Steady
Liquidity is stable. The latest reading, June 20, 2025, of the Fed’s National Financial Conditions Index (NFCI) came in at -0.51 compared to the prior week’s reading of -0.52. This remains positive, although it’s essentially an unchanged number. Negative numbers signify ample liquidity.
Sentiment Summary – Wall of Worry Starts to Wither
The CNN Greed/Fear Index (GFI) is back in Greed territory but is not overheated yet. It closed the week at 65. A move above 70 would be a sign that the momentum run is potentially in its final stages.
The Composite Put/Call Ratio closed at a moderately bullish reading of 0.69. The index P/C ratio closed at 0.82. Combined, these indicators suggest investor bullishness is increasing which in the short term will likely accelerate momentum but also suggests that we are much closer to topping out.
The CBOE Volatility Index (VIX) closed at 16.32. This reading indicates low volume in put options and confirms the action in the Put/Call ratios. VIX rises when traders buy large volumes of put options. Rising put option volume leads market makers to sell stock index futures to hedge their risk and leads markets lower. A fall in VIX is bullish signaling lower put option volume, eventually leads to call buying which is bullish as it causes market makers to buy stock index futures raising the odds of higher stock prices.
The S&P 500 (SPX) broke below 6000 but held above 5850. A sustained close below 5850 would be very negative.
Bond Yields Break Support
The bond market finally broke below recent support after the steady PCE reading. This is a bullish development as it suggests that bond traders are less worried about inflation and that they would agree with a Fed rate cut.

The U.S. Ten Year Note yield (TNX) ended the week below the recent 4.5%- 4.625% trading range and its 200-day moving average. This is bullish with 4.3 now becoming the first level of resistance to watch. Lower bond yields are bullish for homebuilder stocks.
My new book “The Everything Guide to Investing in Your 20s & 30s (3rd Edition) is now available. I recently to discussed the ins and outs of the book on the Get Down to Business Podcast with Scott “Shalom” Klein. You can catch the interview here.

If you have a 401(k) plan that offers ETFs as investing vehicles, consider Joe Duarte’s Sector Selector. It’s FREE with your monthly membership to Buy Me a Coffee. Sign up here. If you’ve been thinking about tuning up your investment playbook, my new book “The Everything Guide to Investing in Your 20s & 30s” is right on the money for you. For those wishing to get started on day trading, consider “Day Trading 101.” For steady gainers, check out the Smart Money Weekender Portfolio. I’ve just added several new positions in this weekend’s edition. Trade better with extra energy, and vitality. Visit my Health Page.
NYAD Makes Consecutive New Highs. Indexes Confirm.
The New York Stock Exchange Advance Decline line (NYAD) a series of new highs last week which suggests there is more upside action left in this rally. A break below the 20/50-day moving average support band would be a significant setback to the bullish trend.

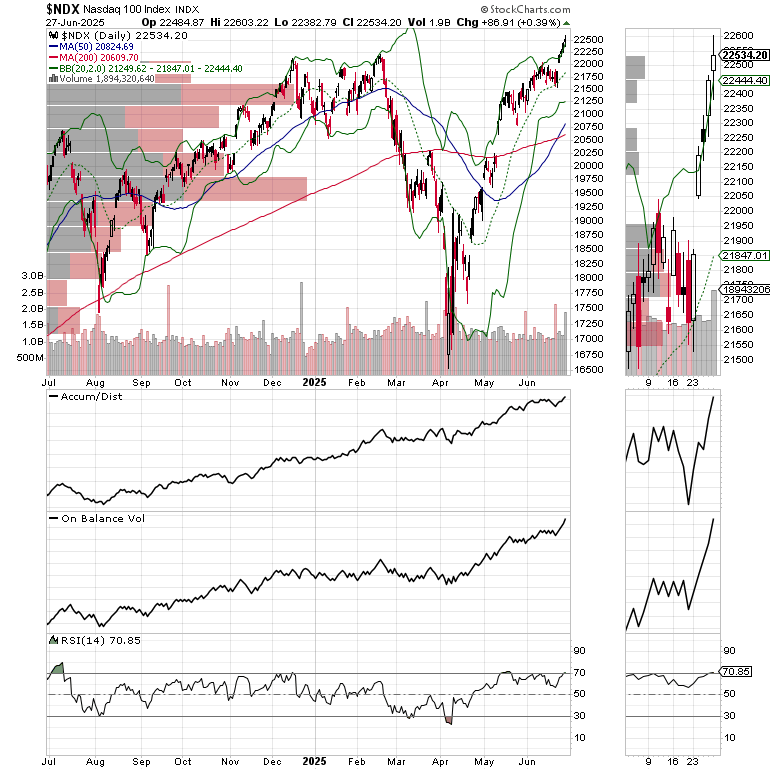
The Nasdaq 100 Index (NDX) confirmed the new high on NYAD and has support at its 20-day moving averages and 22,000.
The S&P 500 (SPX) closed well above 6000 and also made a new all-time high confirming the action in NDX and NYAD. 5950-6100 is the new support band to monitor.

For the definitive book on options trading, check out “Options Trading for Dummies”, now in its 4th Edition – Available Now!

#1 Best Seller in Options Trading – Now in Audible Audiobook Format
Options Trading for Dummies (4th Edition) Audible Audiobook – Unabridged