


Liquidity Gushes as Bonds, Value Stocks, and Bitcoin Dazzle.
It's going to be an interesting week.

The thesis for the Santa Claus rally remains intact, especially with the explosion of liquidity that’s sneaking into the market. However, until proven otherwise, the key to success is to focus on value as growth stocks struggle. On the other hand, if growth stocks join the party, there’s no reason not to hop on board one more time.
Bond traders danced while stock traders licked selective wounds last week as the Fed’s favorite inflation gauge, the PCE came in lower than expected while the Chicago PMI number showed a sharp decline. Together both numbers suggest a slowing economy while offering the Fed a chance to lower rates at its December 18, FOMC meeting.
Joe’s Weekender Portfolio Substack is a reader-supported publication. To receive new posts and support my work, consider becoming a free or paid subscriber.
The major indexes, on the other hand, weren’t thrilled with the data, especially as the technology sector, fueled by an apparent lack of interest in AI seems to be cooling off. Both Dell (DELL) and HP Inc. (HPQ) joined NVDA in the disappointed traders club as the trio failed to impress with their latest earnings.
So where does that leave us? As I noted here last week, this market is transitioning from one led by momentum to one fueled by value and a wider opening of the liquidity spigot. Of course, everything could change in a heartbeat as the November payroll data, both private (ADP) and the NFP numbers roll in next week. And yes, Fed Chair Powell is due to talk, so that adds another potential wrinkle to the trading week.

Liquidity Explosion courtesy of dreamstime.com
Liquidity Ramps Up in a Big Way
The National Financial Conditions Index (NFCI) turned lower last week with the latest reading clocking in at - 0.64, an aggressive move from last week’s -0.57. This larger than usual decline in NFCI signals a rapid increase in liquidity in the financial system, which is finding its way to bonds, value stocks, and Bitcoin. Inside the index, only five components are tighter than average while 100 are looser than average.
Ten Year Note Breaks Below 4.3% - Tests 200-Day Moving Average
As, I’ve noted lately, bond traders have been looking for a reason to buy. And the dam burst last week as the U.S. Ten Year Note Yield (TNX) fell below 4.3% and is now testing the 200-day moving average after the recent tag of its 4.5% resistance area while not quite falling below 4.3%. This is not surprising to regular readers as the recent new highs on TNX were not confirmed by new highs on the RSI, which meant that the upside momentum for yields with each consecutive push up had lessened. Now we need to see a sustained break below the 50-day moving average.

Mortgage rates have also topped out but remain near their recent highs, as they are tied to TNX. As I explain in detail here, this sudden drop in bond yields and the subsequent decline in mortgage rates is likely to move market timing potential home buyers off the sidelines, possibly triggering a December rush into new homes and perhaps even into existing homes. Get more details on this topic here. If you’re not getting my FREE weekly real estate and interest rate updates, you can sign up here.
Bitcoin Has Nive Lives as Buyers Show Up on the Dip
Bitcoin (BTC/USD) dipped briefly last week, picked up speed on a dip buying spurt, as it once again ramps up for a possible test of $100,000.
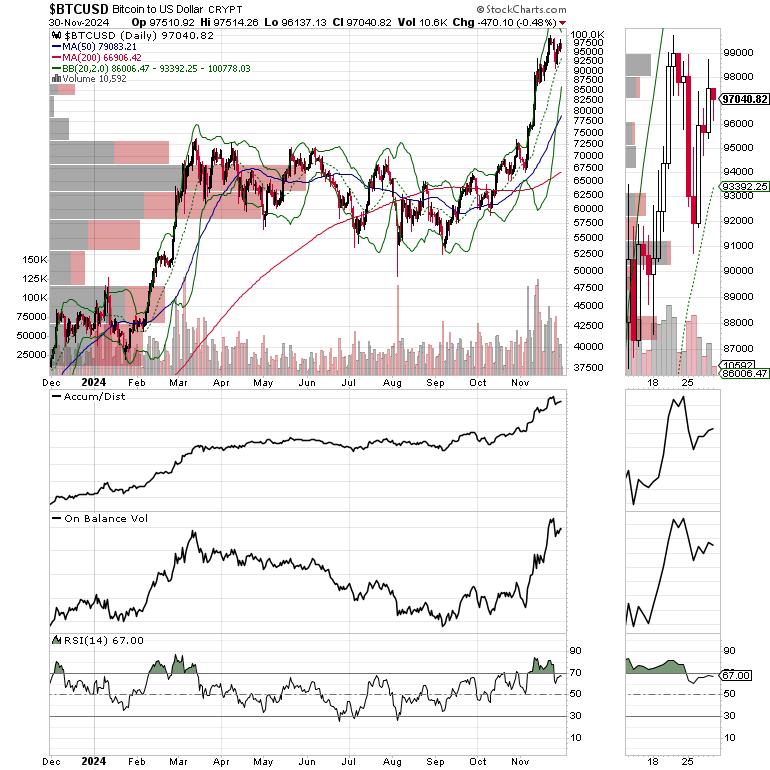
BTC is clearly overbought with the RSI trading well over 70. But it could stay overbought for quite a while as those who have missed the rally play catchup. Meanwhile both the ADI and OBV lines show that money is moving in at an astronomical rate. I’ve recently added two Bitcoin related trades.
Small Caps Gear Up for January Effect
A little discussed seasonal trend, the January Effect, where small caps often rally during the month of January is already taking shape ahead of time, as it often does as investors line up early in expectations of seasonal gains.

The S&P Small Cap 600 Index (SML) is on the verge of a significant breakout with a test of the 1550 resistance area looming. The ADI line is sloping down as short sellers try to beat the index down while the OBV line is perking up as value players start moving in ahead of January. This, of course, sets up the potential for a short squeeze, which if it materializes could deliver some holiday fireworks.

A usually quiet place, the infrastructure sector is once again revving up. The Cohen & Steers Infrastructure Fund just broke out to a new high as the fall in bond yields creates a favorable financing window for road and bridge repairs, especially in the hard hit hurricane stricken areas of the Southeast U.S.
Homebuilders Set Up for Next Move
I’ve been bullish on the homebuilder sector for years. Recently, I’ve recommended adding homebuilders to long term portfolios, while stressing patience and using strategic dips to add to positions. This type of trading tactic is based on the structural nature of the housing supply, the ongoing demographic shifts, and a stealthy set of moves being made by large homebuilders to expand their market share. You can get the details here.
The best kept secret in housing is that large homebuilders are buying up midsized local and regional builders, especially in areas where populations are steadily growing – the South and the Sunbelt. This strategy will likely boost earnings, especially if interest rates fall.
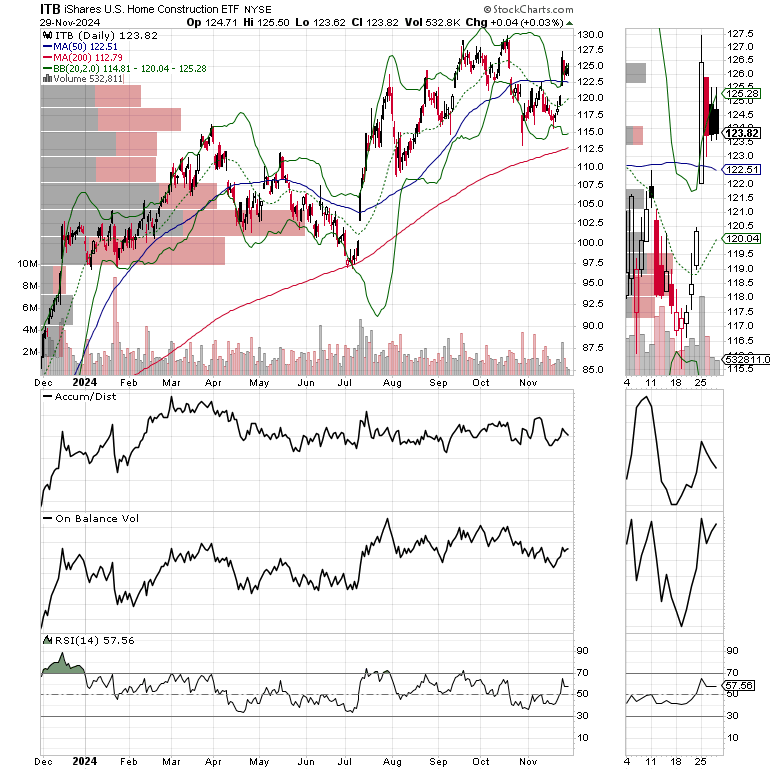
Thus, the iShares Home Construction ETF (ITB) is responding positively to falling yields as they will give way to lower mortgage rates. ADI is rolling over as OBV is perking up, again setting up for a potential short squeeze.
REITs Show Signs of Life
Another contrarian sector which is interesting is real estate (REITs). The iShares U.S. Real Estate ETF (IYR) just crossed above its 50-day moving average.

If you’re an ETF trader, consider, Joe Duarte’s Sector Selector. It’s FREE with your monthly membership to Buy Me a Coffee. Sign up here. If you’ve been thinking about starting a day trading career, my new book “Day Trading 101” will get you started on the right foot. For short term intermediate momentum, and frequent option trades, visit the Smart Money Passport.
NYAD Makes New Highs with SPX as NDX Ramps Up.
The New York Stock Exchange Advance Decline line (NYAD) made a new high last week. This is bullish for the market, especially during the bullish holiday season. The RSI is just above 50 which gives NYAD, and the market room to run.

The Nasdaq 100 Index (NDX) seems to be ramping up for what could be a big move up. ADI and OBV are both rising as NDX found support at its 20-day moving average.

The S&P 500 (SPX) made a new high rising above 6000 once again. The 20-day moving average is support near 5900.

VIX Holds Below 20
The CBOE Volatility Index (VIX), remains below 20 which is a bit of a positive divergence given the recent reversal in stocks.
VIX rises when traders buy large volumes of put options. Rising put option volume leads market makers to sell stock index futures to hedge their risk and leads markets lower. A fall in VIX is bullish signaling lower put option volume, eventually leads to call buying which is bullish as it causes market makers to buy stock index futures raising the odds of higher stock prices.
To get the latest up to date information on options trading, check out “Options Trading for Dummies”, now in its 4th Edition – Available Now!
#1 Best Seller in Options Trading –

Now in Audible Audiobook Format
Options Trading for Dummies (4th Edition) Audible Audiobook – Unabridged
Joe Duarte MD (Author), Terrence Kidd (Narrator), Tantor Audio (Publisher)
4.5 out of 5 stars