Life and the Markets are Digital. The Fed is stuck in analog. What could possibly go wrong?
Extreme and Extraordinary - Is this Time Different?
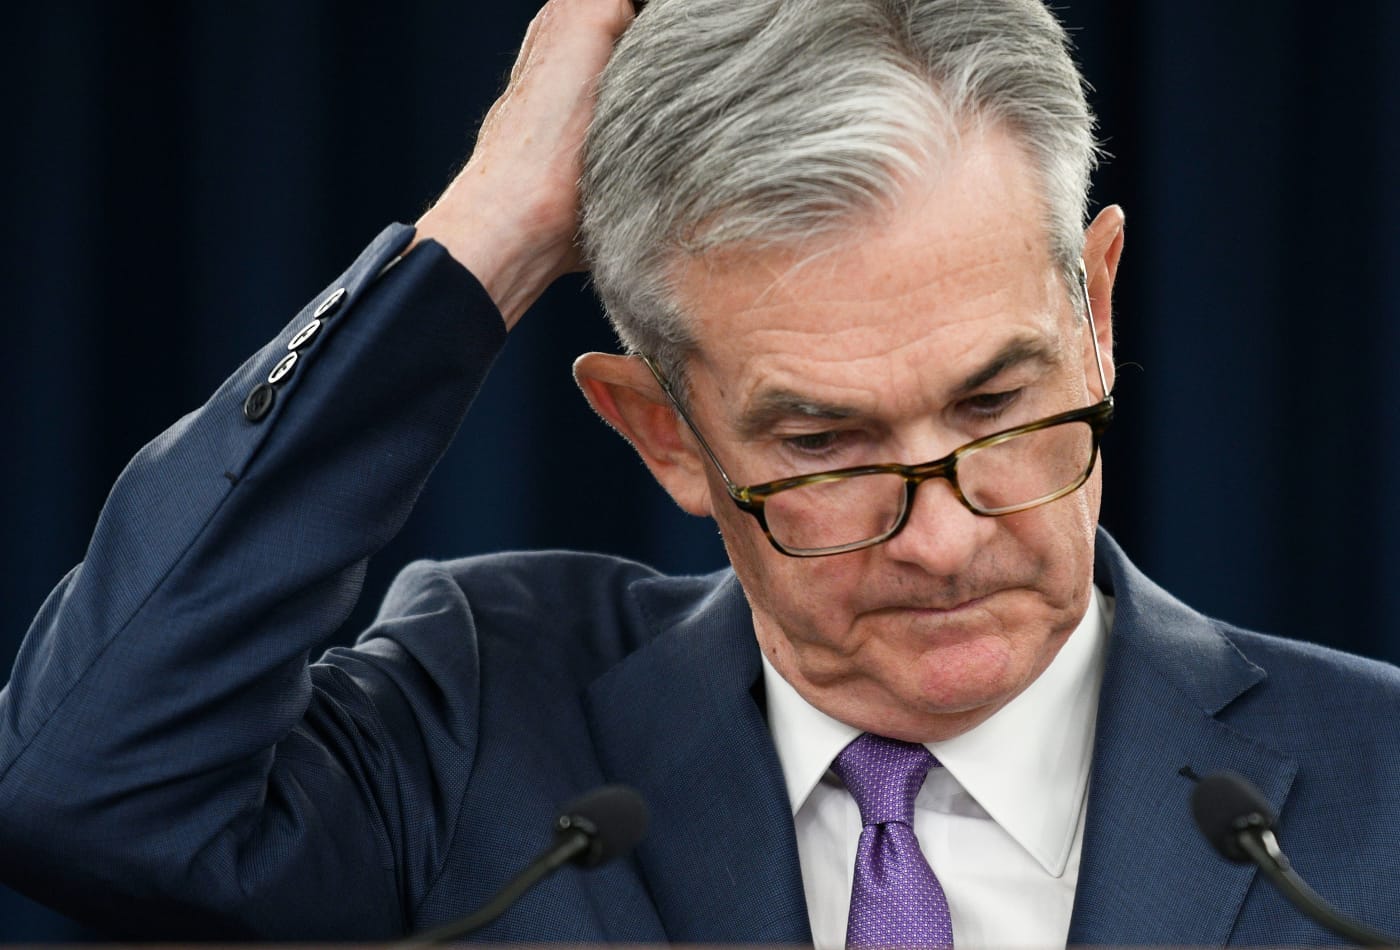
Image courtesy of CNBC.com
Is this time really different? It’s certainly extreme and extraordinary. Indeed, the current market is a test of whether traditional relationships of the global financial infrastructure even work anymore – the broken market thesis is being tested. What we do know, as I describe below, is that the markets and real life events are more interconnected than ever, moving faster and with a more pronounced effect making life a mirror image of a trading screen.
Last week I wrote: “Something is wrong out there. And that usually means some sort of liquidity event is brewing. And the Fed…well they’re asleep at the wheel.” Fast forward and the stock market has crashed and the Fed, well, they’re still asleep at the wheel, as liquidity dries up and stocks crash. But there’s more to the dysfunction of the financial system as I describe below.
Mess with the Markets and You’ll be Messing with the Economy
These days, if you want a recession, just crash the stock market. As familiar readers know, in this new world, the MELA effect, the wealth effect from rising stock prices is the major driver of the economy. When stock prices rise, people, especially professional traders and those who have 401 (k) plans and IRAs feel better.
Here’s the rundown. The price action in the markets (M) affects people’s spending patterns which, in turn, drive the economy (E) and their life and financial decisions such as buying cars, getting married, and buying homes (L). Meanwhile the algos (stock trading machines, big data, and social media) amplify every human decision making everything seem bigger and more important, accelerating their trajectory, and often exaggerating the underlying trends. When stock prices rise, economic things flow more smoothly. When stock prices fall; not so much. The net effect is that daily life often resembles the stock market’s daily grind.
Life and the Markets are Digital, but the Fed is Analog
The Fed’s reference point for action remains in the pre-algo, circa 1995 (the Greenspan soft landing miracle) pre-digital analog times. Think transistor radios. Yet in 2025, a MELA event is unfolding rapidly and violently in digital time (fueled by AI, algos, and social media), which means it could accelerate further since algos just follow coded instructions and learn as they go along. Selling begets more selling because it’s working and the algos are happy to be fulfilling their program (and getting electron bonuses).
During these periods, there is no bottom until the order flow changes. But since no one wants to step into buy, there is no change. So, nothing will change until something different happens, which triggers the next algo program at the speed of light. Such as if the Fed goes back to QE or something equally effective.
For example, the CNN Greed/Fear Index (GFI) hit a low of 4 on Friday (I’ve never seen this before) as stocks wiped out trillions in value in one day. The CBOE Put/Call ratio closed at 1.18 while the CBOE Volatility Index (VIX) exploded to 45. But the Fed wants more data. Millions of traders got this data in real, digital time, while Powell was talking to a think tank and no one from the Fed said anything about the unfolding disaster.
Hello. Is this thing on?
So, we are witnessing a capitulation episode in the markets at digital speed, which raises two possibilities. This is almost over or it’s about to get a lot worse, rapidly.
Consider the following:
• The CNN Greed/Fear Index (GFI) is in nearly off the charts Extreme Fear mode with single digit readings on a regular basis. On Friday, GFI closed at This is normally bullish, but…
• The Composite Put/Call Ratio rose to 1.18. The index P/C ratio is at 1.18. This is closing in on panic levels. This should be bringing in the dip buyers. But it hasn’t.
• The major indexes are trading outside their lower Bollinger Bands. That usually incites a reversal. Yet…
• SPX broke below 5450 and kept falling; extreme and extraordinary
• The Fed is waiting to see the effects of tariffs, but is oblivious about the stock market’s but is oblivious about the stock market’s effect. Sigh!
Bottom line: Don’t hold your breath for relief from the Fed until the analog circuits catch up to reality.
Extreme and Extraordinary – Hello 3-Sigma!
The current market selloff is so extreme that the decline has tagged the lower Bollinger Band corresponding to 3 standard deviations below the 200-day moving average (pink lower line). According to Goldman Sachs (GS), this is the biggest selling spree ever. So, now you’ve lived through a 3-sigma event.
The S&P 500 (SPX) is in an extreme trading pattern connected to the relationship of prices with its 200-day moving average, and its two standard deviation Bollinger Bands (BB, green lines).
When prices touch or break above the upper band, or touch or fall below the lower band, it’s a signal that a reversal is near. The reversal may be to a short/intermediate term support/resistance level such as the 50-day moving average, to a long term moving average, such as the 200-day, or in extreme cases to the opposite Bollinger Band or beyond that important level.
SPX came close to tagging, or breaking above the upper green band in July 2023, March, August, October, November and December of 2024. Each tag of the upper band led to a reversal, usually to the 50-day moving average. This testified to the strength of the bull market as the 50-day line proved to be an excellent place to buy the dip.
The pattern changed with the December 2025 tag of the upper BB. After that we saw a double top in February 2025 and the subsequent break below the 50-day moving average and the 200-day line.
This decline is now pending a reversal, or a truly devastating decline, since SPX is very oversold with the RSI nearing 30 for the second time in 2025 and there has been a tag of the 3-Sigma Bollinger Band, similar to July 2023 (lower pink line). If this doesn’t trigger a bounce. Batten down the hatches.
Bond Yields Collapse. Homebuilder Stocks Respond.
The bond market is screaming RECESSION and the Fed is not listening. What’s more, the homebuilder stocks moved higher during the Friday crash. That suggests that, unlike the Fed, algos somewhere know that lower bond yields are good for mortgage rates.
The U.S. Ten Year Note yield (TNX) broke below 4% last week, and even though it’s oversold (RSI near 30), it has the potential to fall to its September 2024 lows near 3.7%.
The biggest beneficiary of the drop in yields might be the housing market where mortgage rates have fallen and are poised to test the 6.5% level. It’s not certain that 6.5% is good enough to tempt any on the fence buyers into pulling the trigger. But the homebuilder stocks rallied as if they might.
The iShares U.S. Home Construction ETF (ITB) delivered a bullish reversal on 4/4/25, ending the day back inside its lower Bollinger Band with an emphatic engulfing candlestick pattern (a reversal from a new low combined with a close above the prior day’s high). It may not last, but it is encouraging if you’re a long term investor. I’ve been nibbling at the homebuilder stocks for the past several weeks and am not changing my mind about the long term prospects for the sector. You can get the details at the Weekender Portfolio.
Liquidity stabilized but remained tight. The latest reading, March 21, 2025, of the Fed’s National Financial Conditions Index (NFCI) fell slightly to -0.57 from its prior reading -0.56. Four weeks ago, it was at -0.67, so conditions are still tighter than a month ago. Negative numbers signify ample liquidity. Yet, the nearly 10-plus basis point rise over four weeks is cautionary and at least partially explains the general weakness in stocks.
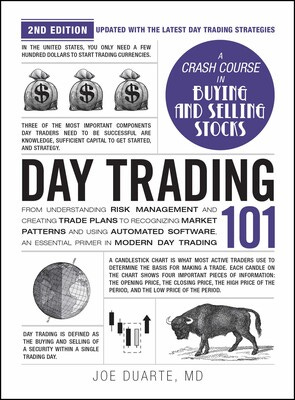
If you’re an ETF trader, consider, Joe Duarte’s Sector Selector. It’s FREE with your monthly membership to Buy Me a Coffee. If you’ve been thinking about starting a day trading career, my new book “Day Trading 101” will get you started on the right foot. For steady gainers, check out the Smart Money Weekender Portfolio. I’ve just added several new positions in this weekend’s edition. Trade better with extra energy, and vitality. Visit my Health Products Page.
NYAD and Major Indexes Hit Extreme Oversold Levels.
The New York Stock Exchange Advance Decline line (NYAD) broke below its 200-day moving average and its lower Bollinger Band while approaching the 30 level on the RSI, suggesting some sort of bounce is building.
The Nasdaq 100 Index (NDX) has collapsed falling to its September 2024 lows before the AI craze hit its fever pitch. The RSI is well below 30.
The S&P 500 (SPX) is discussed above.
VIX Explodes to 45
The CBOE Volatility Index (VIX) exploded to a level of 45. This could be the prelude to a reversal.
VIX rises when traders buy large volumes of put options. Rising put option volume leads market makers to sell stock index futures to hedge their risk and leads markets lower. A fall in VIX is bullish signaling lower put option volume, eventually leads to call buying which is bullish as it causes market makers to buy stock index futures raising the odds of higher stock prices.
To get the latest up to date information on options trading, check out “Options Trading for Dummies”, now in its 4th Edition – Available Now!
#1 Best Seller in Options Trading –
Now in Audible Audiobook Format - Options Trading for Dummies (4th Edition)


Yes the markets are digital and the FED analogue (bits of paper at regular face to face meetings included. But there is another equally digital information dissonance between retail traders and the big financial smart money and their algorithmic feeds, high-frequency trading in large volumes and dark pools for private, undisclosed transactions.
That’s true. The playing field levelers, limited as they are, are the price charts.