


The Four C’s: Complex, Complicated, Confusing and Cosmic. Where did the Dip Buyers Go?
Something’s not adding up. Think Liquidity Squeeze.

Up until recently, I’ve been patient with the daily market action. But something changed on 3/28/25 as the Fed’s favorite inflation gauge (the PCE) came in stronger than expected, and the Michigan Consumer Sentiment Survey featured nearly apoplectic inflationary expectations. Yet, as the headlines blared: “Stocks sink on Inflation Worries,” U.S. Treasury bond yields, the most anti-inflation indicator on Earth hit multi-month lows. Making matters worse, the usual dip buying, especially at the end of the month and the quarter, in stocks was not there on Friday. To be blunt, liquidity is drying up and the Fed is behind the curve; again.

Image courtesy of interactivebrokers.com
The Four C’s: Complex, Complicated, Confusing and Cosmic. Stealthy Dip Buyers Persist.
The current market can best be described by the four C’s: Complex, Complicated, Confusing and Cosmic. Here’s what I mean:
• Complexity is a natural state where infinite moving parts in an adaptive system collide with one another looking for a way out of the current state to a new level of operation; the point of emergence;
• Complicated describes a situation where the artificial hand of man (or AI) invades the natural order and induces a Chaotic state where things become predictably unpredictable;
• The net effect of Complexity and Chaos colliding is Confusion;
• Throw in a cosmic event, as I discussed here, and things get super interesting, especially when liquidity is getting scarce (see NFCI section below).
Lately, the stock market, after a 10% correction, has been looking to find a new operating mode (trolling for a bottom). Yet, the headlines intrude, and Chaos, in the form of algo- related sell programs trigger panicky retail selling and bouts of short selling by hedge funds, leading to investor confusion and more selling. Yet, as the confusion heightens the fear, contrarian investors buy on the dips – resetting the cycle. Unfortunately, that wasn’t evident on Friday as no meaningful dip buying registered, which is concerning.
Indeed, things aren’t adding up. Sentiment remains remarkably bearish. Normally this type of bearishness for this long a period would have spawned a better rally than the one we’ve just experienced. Moreover, with each bout of selling without new lows, the bears should be losing their energy and eventually capitulate. We haven’t seen that yet as they seem to find new strength after each failed rally. That means they think they’re onto something. And that’s never good, especially if they’re right because there’s no liquidity.
More details:
• The CNN Greed/Fear Index (GFI) remained in Extreme Fear mode with readings just above or just below 20 in the past few weeks. On Friday, GFI closed at 22. This is normally bullish. What’s taking so long?
• The Composite Put/Call Ratio remains at a usually bullish 1.02. The index P/C ratio is more bullish at 1.15. This suggests that investors, especially pros, are very concerned. During the week, the composite P/C hit a bullish high of 1.11 on 3/27/25, while the index P/C ratio hit an even more bullish reading of 1.36 at the same time. This should be bringing in the dip buyers. But it didn’t.
• The major indexes are cutting through support when normally bearish sentiment would push them higher.
• SPX closed at 5580 on Friday, breaking below the support level of 5650. A sustained break below 5450 on SPX would likely lead to lower prices in the short term.
Bottom line: Something is wrong out there. And that usually means some sort of liquidity event is brewing. And the Fed…well they’re asleep at the wheel.
Is the Stock Market Running Out of Time?
The action of the S&P 500, viewed in tandem with the 200-day moving average and Bollinger Bands (BB) two standard deviations above and below the prevailing price has been useful over the last few weeks as it provides a long term perspective into the current action. This combination of indicators is most useful when it displays extreme behavior, as when an asset rises above the upper BB or falls below the lower BB. When this happens it reliably predicts a major reversal point.

As the chart shows SPX rose above the upper BB in October, November and December of 2024, prior to reversing toward the mean (the 50 or 200-day moving average). Eventually, SPX topped out in March 2025 with subsequent breaches of the 50 and the 200-day lines.
Last week, SPX failed to rise above 5750 and its 200-day moving average while also folding in its attempt to hold support at 5650. This suggests that we are now likely to test 5550 and perhaps 5450, the bottom of the trading range. A sustained move below 5450 would be very negative and would likely set up a test of the lower Bollinger Band near 5300. Also note that the BB’s are starting to squeeze, which suggests the move is about to accelerate.
Bond Yields Fall Despite Pesky Inflation. U.S. Dollar and Bitcoin Look Tired.
The bond market’s action on Friday was a head scratcher. The PCE came in stronger than expected, yet the U.S. Ten Year Note collapsed. That makes no sense at all, unless bond traders are betting on a recession with lots of fervor.

Bond yields collapsed, preceded by the squeezing of the Bollinger Bands, as I’ve been expecting. The U.S. Ten Year Note yield (TNX) looks set to test its 200-day moving average, as it failed to move above the 50-day MA, and is back below the 20-day MA. A break below the 200-day would be a positive.
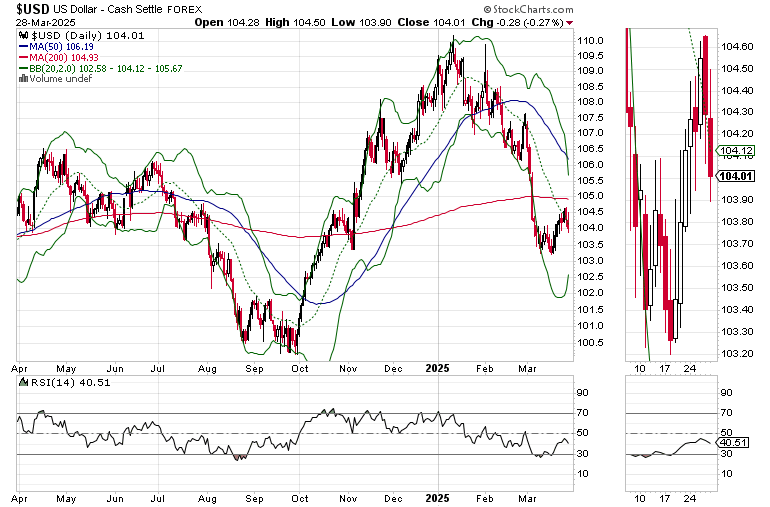
The U.S. Dollar Index (USD) rally may have run its course as USD failed to rally above its 200 moving average. $103 seems to be the line in the sand. A move below $103 could send USD down further.

Bitcoin’s (BTCUSD) big move, predicted by a Bollinger Bands squeeze seems to be to the down side as an imminent breach of the 200-day moving average is unfolding.
Liquidity stabilized but remained tight. The latest reading, March 21, 2025, of the Fed’s National Financial Conditions Index (NFCI) fell slightly to -0.56 from its prior reading -0.55. Three weeks ago, it was -0.59. Four weeks ago, it was at -0.67. Negative numbers signify ample liquidity. Yet, the 10-plus basis point rise over two weeks is cautionary and at least partially explains the general weakness in stocks.
Following Money’s Narrowing Path
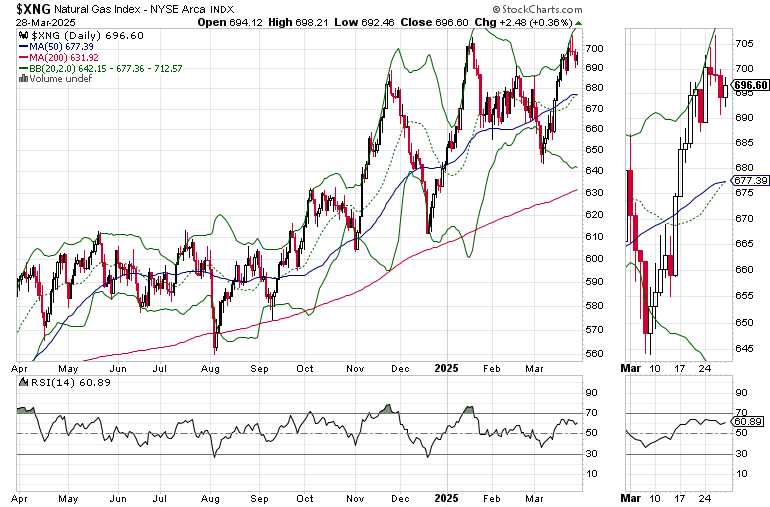
Money continues to flow into natural gas, which has been a sturdy component of the ESP portfolio for some time, and more recently in a sector wide bet at the Weekender portfolio recently. Much of the bullish sentiment is based on expectations of increased energy demand for data centers

A second stealth money magnet sector, which is well represented in all our portfolios, has been the insurance stocks as in the iShares Insurance ETF (IAK). IAK remains in a well-defined uptrend, exhibiting bullish dip buying activity.
If you’re an ETF trader, consider, Joe Duarte’s Sector Selector. It’s FREE with your monthly membership to Buy Me a Coffee. Sign up here. If you’ve been thinking about starting a day trading career, my new book “Day Trading 101” will get you started on the right foot. For steady gainers, check out the Smart Money Weekender Portfolio. I’ve just added several new positions in this weekend’s edition. Trade better and longer with more energy and vigor. SPECIAL PROMOTION - Visit my Health Page and receive one Free Bonus Month to your Smart Money Passport subscription with your first purchase.

NYAD Turns Lower. Indexes Fail to Impress.
The New York Stock Exchange Advance Decline line (NYAD) failed to hold above its 50-day moving average last week, ending the week just above its 200-day moving average but still inside its recent trading range. The Bollinger Bands are squeezing in, however, which means that a big move lies ahead. A break below the 200-day moving average could be bad news for the bulls.

The Nasdaq 100 Index (NDX) was brutally rejected at its 200-day moving and below the 19500-19750 support range. The low end of support is at the 18,000-18,250 level.

The S&P 500 (SPX) is discussed above.
VIX Rebounds Above 20
The CBOE Volatility Index (VIX) rebounded above 20. This is cautionary.
VIX rises when traders buy large volumes of put options. Rising put option volume leads market makers to sell stock index futures to hedge their risk and leads markets lower. A fall in VIX is bullish signaling lower put option volume, eventually leads to call buying which is bullish as it causes market makers to buy stock index futures raising the odds of higher stock prices.
To get the latest up to date information on options trading, check out “Options Trading for Dummies”, now in its 4th Edition – Available Now!

#1 Best Seller in Options Trading – Now in Audible Audiobook Format
Options Trading for Dummies (4th Edition) Audible Audiobook – Unabridged
Maybe there’s a fifth C ahead: Collapse or Capitulation. Strange days.
As Jimmy sang on Red Hill, 'wait a minute, there's somethin' wrong. The key won't unlock the door. Complexity, Chaos and Confusion indeed Joe. Nero comes to mind and the historical characteristics of end of empire epochs. Or perhaps, as you have hinted, planetary alignments or the simple psychology of cascading fear :). In my portfolio, EPD, ET, EMO, DVN and STEW the only green on my screen