


Cliffhanger: NYAD Diverges. Bonds Tank. Bitcoin Flexes its Muscles. Stocks are Vulnerable.
The next few days to weeks could get bumpy.

It could be one of those weeks. The major indexes had a big up day on Friday, but the New York Stock Exchange Advance Decline line (NYAD) broke down. That’s a technical divergence. There may be consequences.

Under normal circumstances, the dismal October NFP number (12,000 new jobs) should have been a boon to bond traders. Yet, this time bonds got hit after the number was released suggesting that the Fed’s next rate cut isn’t likely to be as effective as stock traders and economists hope. That’s because the liquidity in the system is drying up. More important, as I discuss below, is the emerging relationship between U.S. Treasury Bond Yields and the recent rally in Bitcoin.
First, a bit more color on liquidity.
Liquidity Tightens. It’s Only a Matter of Time Before QE Restarts.
I’ve recently been worried about the market’s liquidity, and I’m now increasingly worried, as the Chicago Fed’s National Financial Conditions Index (NFCI), just ticked up after heading lower in August, September, and most of October. A decline in NFCI is a bullish indication of liquidity in the financial system and coincided with the most recent rally in stocks.
Bond traders continue to fritz out about inflation; for good reason. The PCE data and the inflation components of recent ISM and PMI data continue to point to persistently high prices. Anyone who goes to the grocery store, has to pay rent, or recently got a mortgage certainly knows that until proven otherwise, inflation is now structural.
But here’s the thing. When bond yields rise liquidity gets scarce. That’s because the proceeds of the bond sales often go into cash, or more recently Bitcoin, which in turn removes liquidity from the system (see NFCI reference above). In other words, bond traders are raising cash because they don’t like the odds of holding their bonds until maturity at current yields as inflation saps into their returns. They’d rather wait for a future buying opportunity when yields are higher. That money sits in money market accounts or Bitcoin and collects interest or just waits the moment out. It doesn’t get loaned to anyone and less of it than usual goes into stocks. That’s why the stock market has been sluggish of late, with NYAD now increasing its weakness.
Altogether this sets up a scenario where the Fed’s rate cuts and the liquidity the rate cuts put into the system are just enough to offset the amount that’s left the system via the bond sales. So, in the end, the Fed isn’t really fixing any liquidity problems and the system is stagnant as the flow of money, which greases the economic skids and pushes stocks higher stalls.
Liquidity squeezes are painful in the short term as markets contract and fear rises. Yet, if this one follows the script, the Fed will realize it’s pushing on a string and will eventually restart QE, which increases the risk of inflation, barring a truly weak economy.
On the upside, unless this time is different, stocks will likely rally. To prepare for lower yields, check out my recent post on the subject.
Bitcoin – the New Flight to Safety Asset
As I state above, the normal course of things is for money that leaves the bond market to go into cash as traders wait for higher yields to re-establish bond trades. Yet, in the current market an the rise in the U.S. Ten Year Note yield (TNX) has closely followed Bitcoin’s recent rally. This, of course, suggests that money is being transferred from U.S. Treasury bonds to Crypto.

As the price chart shows, both the December 2023 to May 2024 and the more recent backup in the U.S. Ten Year Note yield (TNX) correspond to rallies in Bitcoin, while the decline in yields in between both rises corresponded to a period of weakness and consolidation in Bitcoin. Certainly, there is no way to be absolutely sure of this relationship, but at its most basic level of visual comparison it holds up.
That means that the markets should be watching what happens in Bitcoin and TNX simultaneously, as the possibility that Bitcoin is replacing U.S. Treasuries as a potential flight to safety is now a possibility.
Homebuilders Flounder as Bond Yields Choke Activity
Last week, I suggested that long term bullishness on homebuilders is warranted, based on the current status of supply and demand but that in the short term, things could get dicey.

Unfortunately, I was right as a bearish earnings report from D.R. Horton (DHI) placed a dark cloud over the entire sector, where even record earnings from Green Brick Partners (GRBK) couldn’t bring things back. I detailed the developments here. If you missed it, it’s worth your time to review the article.
The short version is that supply and demand still favor homebuilders, but their margins are shrinking and the need for price cuts and other incentives is rising. Moreover, rising political uncertainty and fewer potential buyers due to high prices are starting to cause problems for all but those builders who cater to high net worth clients. I own shares in DHI and GRBK.

The iShares Home Construction ETF (ITB) is still in a sideways trading pattern, but not showing much spunk lately. A fall to the 200-day moving average is still possible. As I’ve noted lately, ITB is oversold, as the RSI is trading near 30. But given the recent action in DHI and GRBK, it’s a good idea to give this group some room for now.
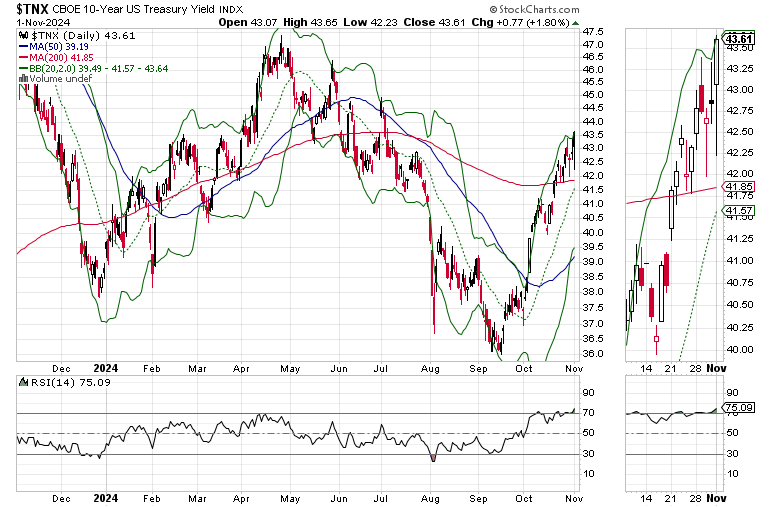
U.S. Ten Year Note Stubbornly Remains Above 4%.
Bond traders know that economic growth is flat. Yet, the U.S. Ten Year Note Yield (TNX) remains stubbornly above 4%, as inflation concerns counter sluggish growth. This rise in yields is a contributor to falling liquidity in the stock market. Another negative is that the 200-day moving average for TNX is now support, which suggests yields may move higher in the short term even as they are well overextended (RSI near 70). Again TNX is flirting with a move outside the upper Bollinger Band which would signal a pending reversal to the 20-day moving average.
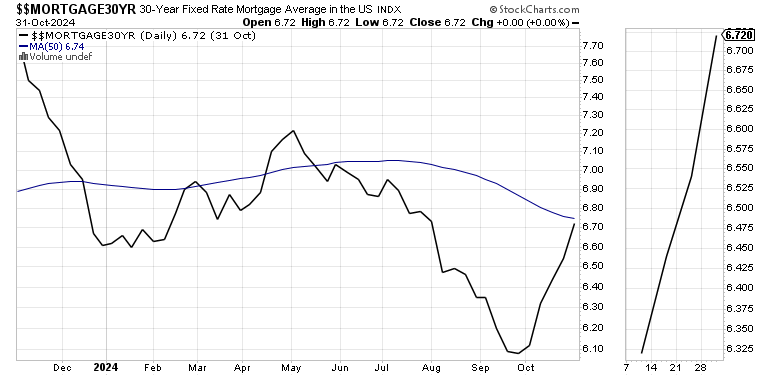
Mortgage rates are testing a key resistance level. Will the recent mortgage activity continue as panic sets in? Get the details on this topic here. If you’re not getting my FREE weekly real estate and interest rate updates, you can sign up here.
If you’re an ETF trader, consider, Joe Duarte’s Sector Selector. It’s FREE with your monthly membership to Buy Me a Coffee. Sign up here. If you’ve been thinking about starting a day trading career, my new book “Day Trading 101” will get you started on the right foot. For momentum trades, visit the Smart Money Passport.

AD Divergence from Indexes Signals Trouble Ahead.
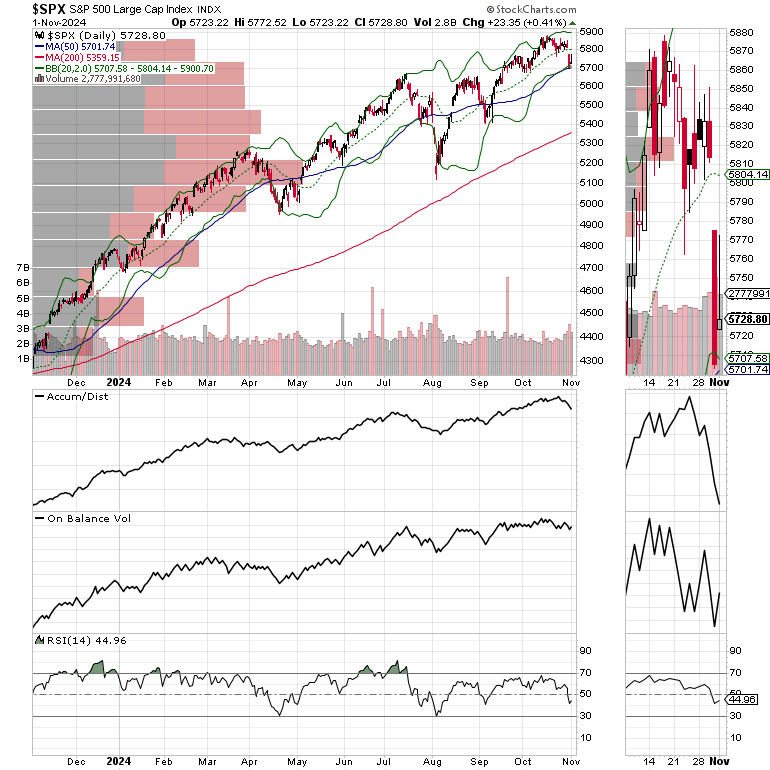
On 11/1/24, the New York Stock Exchange Advance Decline line (NYAD) broke below its 50-day moving average on the same day that the major indexes managed to end the day with a gain. That’s a technical divergence. On the plus side, NYAD is nearing a 30 reading on its RSI which may lead to a bounce.

The Nasdaq 100 Index (NDX) faded much of last week but bounced back on Friday. Still, NDX is testing key support near 20,000 (50-day M.A. and large VBP bar).

The S&P 500 (SPX) is also hanging on a cliff as it tests its 50-day moving average.
VIX Reverses to the Up Side
The CBOE Volatility Index (VIX), is back above 20. Expect volatility to increase in the short term.
VIX rises when traders buy large volumes of put options. Rising put option volume leads market makers to sell stock index futures to hedge their risk and leads markets lower. A fall in VIX is bullish signaling lower put option volume, eventually leads to call buying which is bullish as it causes market makers to buy stock index futures raising the odds of higher stock prices.
To get the latest up to date information on options trading, check out “Options Trading for Dummies”, now in its 4th Edition – Available Now!
#1 Best Seller in Options Trading –

Definitely going to be one those weeks that we get every 4 years.
An interesting week ahead, to say the least.