


Capitulation Episode in Progress. Now What?
Let's see how this thing unfolds. Powell will likely have the swing vote.

To say the least, things are very fluid this morning. But don’t fall asleep at the wheel. There is a chance that things could turn in a hurry as capitulation both in the markets as well as in the political realm and at the Fed could manifest quickly.

Image courtesy of dreamstime.com
All I can say is Wow!! The CNN Greed/Fear Index (GFI) opened at 6 this morning, eclipsing the “I’ve never seen this” spectrum reading of 9 registered yesterday. Meanwhile the CBOE Volatility Index (VIX) exploded to 38 at the open.
In other words, we are now in the midst of a true capitulation episode. The flip side is that as the Godzilla Trader aptly put it this morning, if things don’t turn around, we truly may have a “catastrophe.” Let’s see if the Fed is up to the task or if they will just let the markets, which lead the economy crash and burn.

The New York Stock Exchange Advance Decline line (NYAD) broke below its 200-day moving average and the S&P 500 (SPX) broke well outside the lower Bollinger Band for its 200-day moving average (more on that below).
Finally, the U.S. Ten Year Note Yield (TNX) crashed below the crucial support of the 4% yield, as traders bet on a recession.

You can see that on a long term basis, TNX is on a path to test the September 2024 lows of 3.65%. It’s hard to know what that may bring. But there it is.
Why This All Matters
There are no certainties or coincidences in life. Perhaps the most striking of all setups is that Fed Chairman Powell is scheduled to speak this morning. It’s hard to predict what he will say. But I can safely say that the market is hoping for something that says the Powell put is back and that the Fed’s about to start an emergency easing cycle. If Powell doesn’t provide some comfort, expect things to get even worse.
That said, this market is set up for a reversal. Indeed, if the S&P 500 (SPX) follows a normal trading pattern, that reversal should happen fairly quickly. Much depends on Powell and how things develop on the tariff front. Don’t expect China to back down. But if enough of other affected countries back down on their tariffs we may get some relief.
Usually, investors map the market based on the relationship between the S&P 500 (SPX) and the upper and lower Bollinger Band as they form in response to the 20-day moving average. But there’s a much more reliable version of this useful relationship which is crucial to reviewing the long term trend of stock prices.
For the past few weeks, I’ve noted that the S&P 500’s normal long term trading pattern is governed by the relationship of its price to its 200-day moving average and the Bollinger Bands that extend two standard deviations above and below the 200-day moving average. This relationship forms a visible and useful envelope which reliably shows us when meaningful changes in the long term trend of stock prices are likely.
When prices touch or break above the upper band, or touch or fall below the lower band, the odds are that eventually there will be a reversal to the mean. The reversal to the mean may be to a short/intermediate term support level such as the 50-day moving average, to a long term moving average, such as the 200-day, or in extreme cases to the opposite Bollinger Band and perhaps beyond that important level.
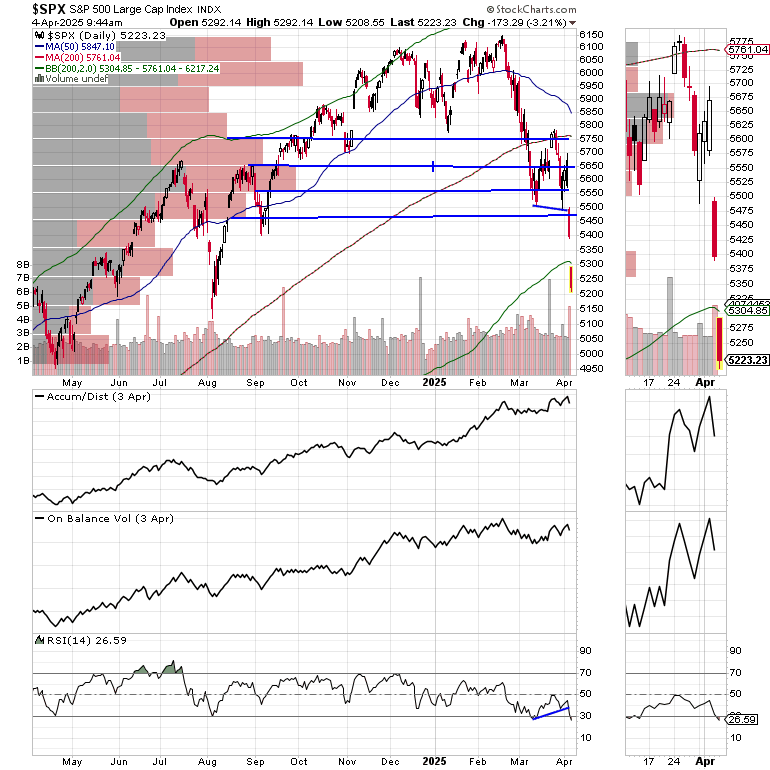
You can see this relationship playing out quite well over the past two years as we saw SPX come close, tagging, or breaking above the upper band in July 2023, as well as in March, August, October, November and December of 2024. Each tag of the upper band led to a reversal, usually to the 50-day moving average. This testified to the strength of the bull market.
Where things changed was after the December 2025 tag of the upper BB. After that we saw a double top in February 2025 and the subsequent break below the 50-day moving average and the 200-day line.
This decline may still reverse at any time since SPX is very oversold with the RSI nearing 30 for the second time in 2025. But the odds favor that before the market turns up, or moves sideways for a while, it will have to tag or break below the lower BB, as it did in October 2023.
Moreover, even if there are some opportunities to trade short term upside reversals, before we get the all clear for at least an intermediate term rally, which lasts weeks to months, we should see SPX move back above its 200-day moving average convincingly.
Here’s what to do:
As I noted yesterday. Subscribers to the Smart Money Passport and the Weekender Portfolio have been preparing for this situation over the last few weeks by raising cash and rotating toward a handful of lower beta stocks in the insurance, utility, and natural gas sectors. By and large, our holdings are showing relative strength. That said, it would not be unexpected to see some of these stocks get stopped out as the volatility increases.
Moreover, if you have some profits, it’s a good time to take them. Recently we took $419 in profits in two option positions at the Weekender Portfolio. Earlier we took a $1058 profit in the Smart Money Passport.
Therefore, the best approach is to stay focused and patient. Manage each individual position. If it gets stopped out, then move on to managing what’s left in the portfolio. If all positions get stopped out then your cash level should be near 100%, which gives you plenty of buying power for when the market turns around.
In this type of market, there is no point in buying shares, no matter how attractive the stock may look until we get an all clear signal which would likely be led by a stabilization of the New York Stock Exchange Advance Decline line and a successful reversal above 5450 on the S&P 500. Moreover, this type of an improvement would be further supported by improvement on the tariff front and assurances from the Fed that they will improve the market’s liquidity.
Thanks to everyone for your ongoing support. I really appreciate it.
Thanks also to all the current Buy Me a Coffee members and supporters. Special shout out to new members who now have access to the Sector Selector ETF Service, included, at no extra charge with your Buy Me a Coffee membership.
For active trading, short term trading strategies, check out the Smart Money Passport.
For large potential profits with longer term holding periods in stocks check out the Smart Money Passport Weekender Portfolio.
If you’re thinking about day trading, my new book – Day Trading 101
– will get you started along the right path.
SPECIAL PROMOTION! - In this market you’ve got to stay healthy and alert. Grab some great clean energy and vitality products and get your edge back on our health page. As a special bonus, you will receive a Free one month subscription to the Weekender portfolio with your first health purchase.