


An Unlikely Trio: the Fed, the Middle East, and the System’s Liquidity. What Does the Fed’s Waller Know? Is a Liquidity Tsunami Ahead?
Don’t be fooled by the Summer Doldrums. Liquidity and geopolitics are headed for a confrontation. Get the shopping list ready to deploy.


Image courtesy of freepik.com
On the surface, the trading volume is down, and the summer doldrums are here. But don’t be fooled. A big move is setting up. You can see it in the steady squeezing of the Bollinger Bands around NYAD, SPX, and TNX (see below for details). Yet, a surprising departure on current policy from a senior level Fed governor suggests something may be up.
Will PCE surprise on the low side? If it does, we may see some serious action.
Consider the following. The Middle East is heating up, global central banks are cutting rates, and the Federal Reserve may join the club as early as July; at least based on recent comments by Fed Governor Christopher Waller who in a recent CNBC interview opened the door for lower rates as early as July. Waller, who seems to be looking at the real world more objectively than Fed Chairman Powell cites the recent flattening out of inflation as a reason to explore rate cuts.
Certainly, Waller’s pronouncements may not be accidental as this week’s liquidity measures (see the NFCI below) suggest that liquidity is adequate, but the rate of rise may be stalling. And given the stock market’s central role in fueling spending patterns via the wealth effect, a stall in the financial system’s liquidity could tip the stock market into a decline and extend into the economy, triggering a recession. Moreover, the harsh reality is that with the current level of debt in the system, flat liquidity, even if adequate for the present, doesn’t really do the job, which means that Mr. Waller may not be a Powell dissenter but more of a stealth messenger from the Fed of what may lie ahead.
Does Waller know something about the PCE?
A more concise way to look at the situation is that the Fed’s back door easing and the Treasury’s stealth maneuvers aren’t doing the trick, especially at a time when geopolitical uncertainty is rising. We’ll know more after the upcoming PCE number. Any positive surprise, especially a number well below expectations will likely increase the chances of a Fed rate cut.
An Unlikely Trio – The Fed, the Middle East, and the Status of Liquidity
Waller’s words and its relationship to what the Fed may be thinking, the upcoming PCE, and the rising uncertainty in Middle East set up the potential for an opening of the liquidity spigot from the Fed, which would add to the already steady stream of money in the system from the Treasury’s T-Bill maneuvers, the Fed’s backdoor T-bond purchases. Along with the international central bank rate cuts such as the recent reduction from the Swiss central bank to zero, which followed the eighth consecutive rate cut from the ECB, the liquidity situation could explode.
Thus, underlying expectations of Fed rate cuts, and a rise in liquidity, could explain the steadiness of the stock market, as in the New York Stock Exchange Advance Decline line (NYAD) and the S&P 500 (SPX) holding above 5850 have suggested was plausible. The fly in the ointment is what it’s been for the past seven months, the Washington fiscal political games and the increasingly perilous geopolitical situation.
From a trading standpoint it pays to be ready for just about anything. Here are some useful rules:
Be ready for a big move – up or down;
Stay calm and focused;
Follow the status of the market’s liquidity closely (see below for details on the NFCI);
Keep abreast of the market’s sentiment (see below for details);
Monitor each portfolio position individually;
Consider taking profits on positions that are extended and thus vulnerable to profit taking;
If a position is stopped out, move on;
If a position is not stopped out, keep it in the portfolio; and
Hedge as needed. I’ve recently added an insurance trade in both the Smart Money Passport and the Weekender Portfolio and most importantly:
Get that shopping list ready to deploy.
Following the Stealth Money
There are three important sectors to monitor as the current situation unfolds.

First, is the central cog in technology, the semiconductor sector (SMH). SMH remains resilient. So far, SMH remains above the 20 and 200-day moving averages. A more bullish view is that SMH has found support at $260 with $265 becoming important resistance.

The financial sector (XLF), is still consolidating, perhaps reflecting the slowing of the system’s liquidity. A sustained move below the 50 and 200-day moving averages for XLF would be very negative for the market. For more details on ETF investing, check out our Sector Selector Portfolio, which can be a useful addition to your retirement investment research for your 401 (k) or self-directed IRA.
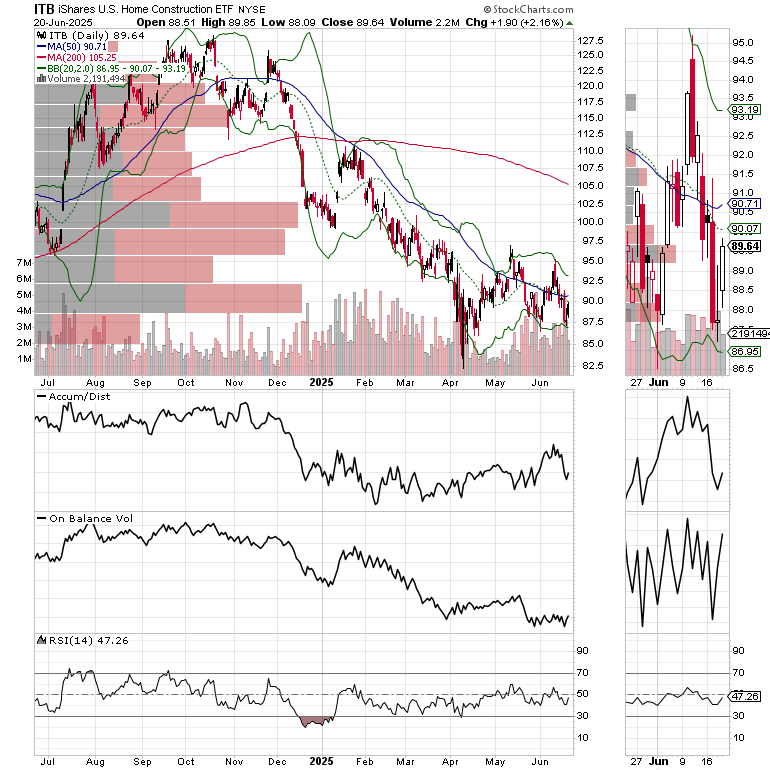
Finally, it’s worth looking at the housing sector via the homebuilders (ITB), as building permits and housing starts have hit new lows and homebuilder sentiment is about as bad as it was at the height of the pandemic. Traditional contrarian analysis would suggest that a bottom may be close at hand.
The price chart suggests that long term investors may want to dip their toes in the water here. ITB has not made a new low for two months even as the news seems to be getting worse. Moreover, the OBV line is starting to rise as the ADI line is starting to drop. This sets up the potential for a short squeeze, which could erupt if the situation in the Middle East improves and the Fed juices up liquidity.
Bottom line – Liquidity remains the key to the markets once external events are excluded.
The bottom line is that there are indicators that something’s about to give. If the Middle East situation worsens and the Fed doesn’t add liquidity the financial markets and the economy are in trouble. Yet the Fed may be close to delivering a pleasant surprise.
Liquidity Watch – Financial Conditions May be Stalling
Liquidity is rising. The latest reading, June 6, 2025, of the Fed’s National Financial Conditions Index (NFCI) came in at -0.52 compared to the prior week’s reading of -0.51. This is a positive, although it’s essentially an unchanged number. Negative numbers signify ample liquidity. Let’s see if the Fed’s stealthy moves are good enough to keep the markets from unraveling.
Sentiment Summary – Wall of Worry Rises Again
The CNN Greed/Fear Index (GFI) spent much of last week in the neutral range, which is a positive. It closed the week at 55 – an encouraging sign suggesting caution is rising.
The Composite Put/Call Ratio closed at a moderately bullish reading of 0.92. The index P/C ratio closed at 1.31, a more bullish reading. Combined, these indicators are displaying a rise in fear, especially from institutional investors.
The CBOE Volatility Index (VIX) closed at 20.82 reversing the bullish readings we had seen over the last few weeks. VIX rises when traders buy large volumes of put options. Rising put option volume leads market makers to sell stock index futures to hedge their risk and leads markets lower. A fall in VIX is bullish signaling lower put option volume, eventually leads to call buying which is bullish as it causes market makers to buy stock index futures raising the odds of higher stock prices.
The S&P 500 (SPX) broke below 6000 but held above 5850. A sustained close below 5850 would be very negative.
Bond Yields Fall
The bond market remains range bound, but is leaning toward the bullish side. A break above the recent upper limit of yields would be a very negative sign. A bullish PCE reading could send yields decidedly lower.

The U.S. Ten Year Note yield (TNX) ended the week just below the recent 4.5%- 4.625% is trading between the 50 and 200-day moving averages. A break above or below the current support and resistance levels will likely be very meaningful.

If you have a 401(k) plan that offers ETFs as investing vehicles, consider Joe Duarte’s Sector Selector. It’s FREE with your monthly membership to Buy Me a Coffee. Sign up here. If you’ve been thinking about tuning up your investment playbook, my new book “The Everything Guide to Investing in Your 20s & 30s” is right on the money for you. For those wishing to get started on day trading, consider “Day Trading 101.” For steady gainers, check out the Smart Money Weekender Portfolio. I’ve just added several new positions in this weekend’s edition. Trade better with extra energy, and vitality. Visit my Health Page.
NYAD Remains Range Bound. Still Close to New Highs.
The New York Stock Exchange Advance Decline line (NYAD) delivered a closing new high two weeks ago but has been quiet since then as the market awaits geopolitical developments and the Fed’s next move. Still, NYAD has remained very resilient consistently closing above key support. Note the Bollinger Band squeeze as a big move sets up. A break below the 20/50-day moving average support band would be a significant setback to the bullish trend.

The Nasdaq 100 Index (NDX) again remained above 21,500 and its 20-day moving averages despite a test of the latter. NDX continues to struggle to rise above 22,000. The 200-day moving average remains key support.

The S&P 500 (SPX) failed to hold above 6000 after topping it temporarily last week. The 20-day moving average and the 5850-5950 support band are important support levels. 6100 is the next resistance level to watch.

For the definitive book on options trading, check out “Options Trading for Dummies”, now in its 4th Edition – Available Now!

#1 Best Seller in Options Trading –
Now in Audible Audiobook Format
Options Trading for Dummies (4th Edition) Audible Audiobook – Unabridged