


Will the Summer Doldrums Help this Market Rebuild Investor Confidence?
How to manage volatility and tame the anxiety with a bulletproof trading plan.

Volatile markets create havoc with investor psyches and pocketbooks. Even worse, they create anxiety; sometimes to the point where anyone can make themselves physically ill. Yet, it doesn’t have to be this way. Instead of panicking and worrying, it’s better to develop a two tiered investment plan based on a simple principle; making trading decisions based on when you will need the money.

Image courtesy of cloudfront.net
Don’t Let the Summer Doldrums Fool You
We’re entering that seasonal period in the stock market traditionally called the “Summer Doldrums” where the big money cats go off to the Hamptons and other haughty vacation spots and leave the shop to the underlings. Tradition says that trading volume drops and daily price action becomes dull starting on Memorial Day extending through Labor Day.
I wouldn’t bet on it this year since bots don’t go on vacation and there are still way too many shoes that could drop and create volatility. Tariffs, geopolitics, and budgetary wranglings in Washington are three that come to mind. That said, there are still plenty of areas in the market which are screaming values, and where investors with long term time horizons can patiently add to positions.
In other words, the external factors that guide the trading programs of headline reading algos aren’t going away. That means that the “Summer Doldrums” may be just as volatile as the first five months of the year; a fact that could be worse if trading volume drops and volatility increases further as a result.
But don’t let the market get you down. You can survive and even thrive during difficult markets by being prepared.
Tame the Anxiety. Use the Doldrums to Bulletproof Your Trading Plan.
Even if things slow down over the next few weeks, this is no time to get complacent. Instead, it’s time to hone one’s analytical skills and review trading plans. And a very useful exercise is to consider whether any position is designed to offer short term income or to contribute to long term wealth formation.
Here is the key question to ask yourself: Is this position designed to deliver current income, or will it contribute to my long term wealth plan? The answer will lead you down the right path and relieve your anxiety.
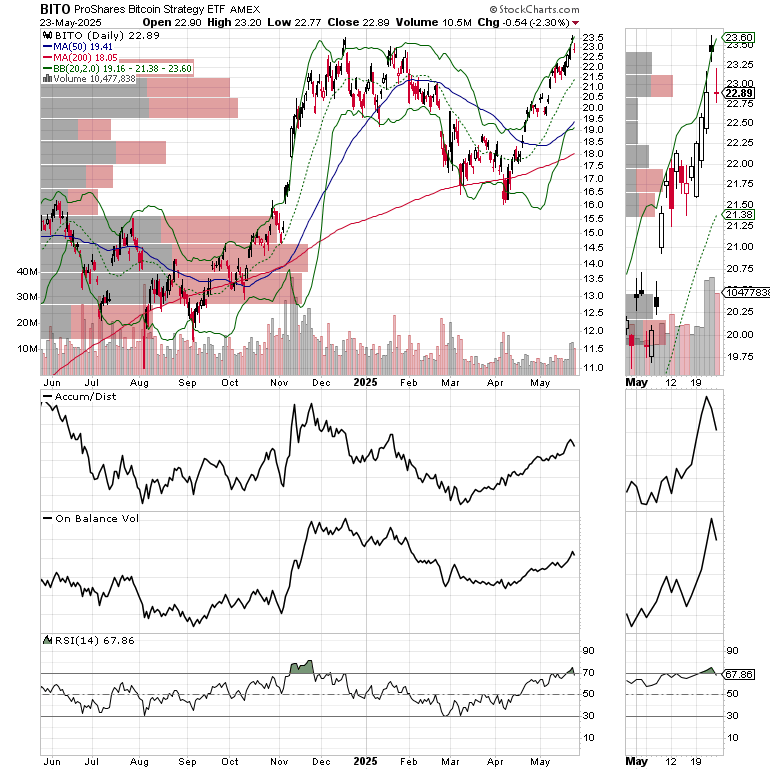
A perfect example may be that of investing in Bitcoin ETFs. Given the inherent volatility in the underlying cryptocurrency, one may decide that this is a short term trading vehicle designed to deliver short term gains. You may wish to cap the gain at $300/100 shares and anchor the profits to a particular expense, such as a car or credit card payment. Or you may wish to set a Sell stop below a short term moving average now that the ETF has delivered a nice profit. We’re currently managing a nicely profitable Bitcoin ETF position at the Smart Money Passport. Incidentally, for a limited time, you can access our Memorial Day Special Offer of 20% off for One Year Subscription.
On the other hand, if you choose to make a position part of your long term wealth building portfolio, you are more likely to give it more time to blossom. In the current market, there are two sectors which are well suited for this purpose.

One of them is the semiconductor sector, SMH where AI and related technological advances such as self-driving cars and space exploration are likely to provide long term revenue and earnings streams to these companies. If you’ve got several years before you’ll need that money, you can afford to endure short term pain and buy on dips, with the understanding that at some point, you will take your profits either partially or fully.
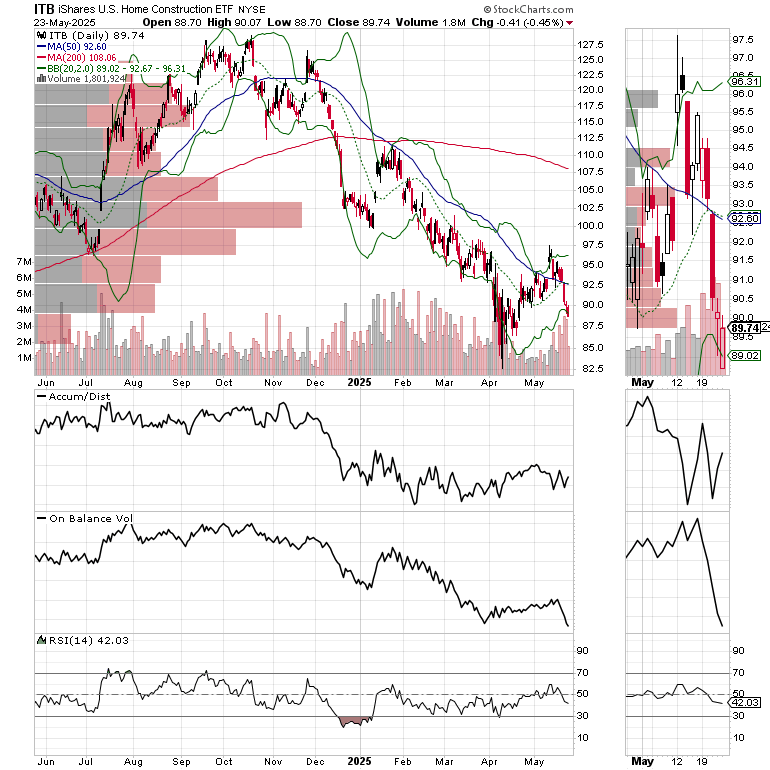
The second is the housing market. As I recently laid out in this deep dive into bullish developments in the sector, the structural nature of the housing shortage puts the homebuilders in charge of the situation. In addition, as I noted here, the stealthy consolidation in the sector is allowing the strong players to get stronger as the weak players get washed out. Over time that means the survivors will have larger market shares and stronger balance sheets.
So, while Bitcoin may be suitable for short term trading and income production, semiconductors and homebuilders offer a different set of opportunities geared toward long term wealth building. In both cases, such as with SMH and ITB, an advisable approach would be to let the current jitters calm down and to use a steady basing process as a place to add to long term wealth building positions. These ETFs offer a perfect opportunity for your 401 (k) or self-directed IRA.
If you want more details on how to trade and invest prudently, and how to develop a bulletproof trading plan, check out my appearance on the Gold Rush Podcast here.
Bottom line:
Volatility and uncertainty are two of the stock market’s founding principles. You can’t escape them, but you can manage them by accepting their existence and designing a trading plan which suits your purposes. One simple strategy is to decide whether any position you enter is designed for short term income or long term wealth generation. Positions designed for short term income, by design, should have a short term time frame. This approach is especially useful for trading options. Positions designed for long term wealth building can be managed with more patience.
Liquidity Watch – Liquidity Rebounds Giving Stock Market a Boos
Liquidity improving and the stock market is likely to benefit. The latest reading, May , 2025, of the Fed’s National Financial Conditions Index (NFCI) came in at -0.58 compared to the prior week’s -0.51. This is encouraging but still off the very loose conditions we saw in February. Still, it’s a plus. Negative numbers signify ample liquidity. Yet, the nearly 10-plus basis point rise over four weeks is cautionary and at least partially explains the general weakness in stocks.
Sentiment Summary – Greed Readings are Worth Watching
The CNN Greed/Fear Index (GFI) closed last week at 64 at the midpoint of Greed. This indicator needs to decline further to rebuild the wall of worry required to push stocks higher.
The Composite Put/Call Ratio closed at a neutral reading of 0.91. The index P/C ratio closed at 1.27. Both indicate that investor fear is rising ahead of a three day weekend.
The CBOE Volatility Index (VIX) closed at 22.29 climbing back above 20 and confirming the unease in the market highlighted by the above chronicled Put/Call ratios. VIX rises when traders buy large volumes of put options. Rising put option volume leads market makers to sell stock index futures to hedge their risk and leads markets lower. A fall in VIX is bullish signaling lower put option volume, eventually leads to call buying which is bullish as it causes market makers to buy stock index futures raising the odds of higher stock prices.
The S&P 500 (SPX) fell but held above its 200-day moving average and 5750. The index needs to recover above 5850 before making a move toward 6000. A move above 6000 almost assures a retest of the recent highs.
The U.S. Treasury bond market had a tough week but ended inside its recent trading range.
Bond Yields Reverse at Top of Trading Range
The bond market, as I’ve noted multiple times of late was likely, reversed course after becoming overextended on 5/23/25. Certainly, there are some valid reasons for concern in the treasury market, especially with the Japanese bond market entering a difficult period where buyers there are becoming hard to find.

The U.S. Ten Year Note yield (TNX) extended its trading range slightly last week, but is still trading between 4.3 and 4.6.25% with the 200-day moving average providing support.

If you have a 401(k) plan that offers ETFs as investing vehicles, consider Joe Duarte’s Sector Selector. It’s FREE with your monthly membership to Buy Me a Coffee. Sign up here. If you’ve been thinking about starting a day trading career, my new book “The Everything Guide to Investing in Your 20s & 30s” will get you started on the right foot – pre-order now. For steady gainers, check out the Smart Money Weekender Portfolio. Trade better with extra energy, less stress and more vitality. Visit my Health Page.
NYAD Bends but Doesn’t Break
The New York Stock Exchange Advance Decline line (NYAD) broke down last week after a temporary new high. The indicator closed at its 20-day moving average while the RSI closed just above 50. This suggests that traders are on the verge of making a big decision about the market’s trend. A failure at the 20-day and a break below 50 on RSI will likely trigger more selling.

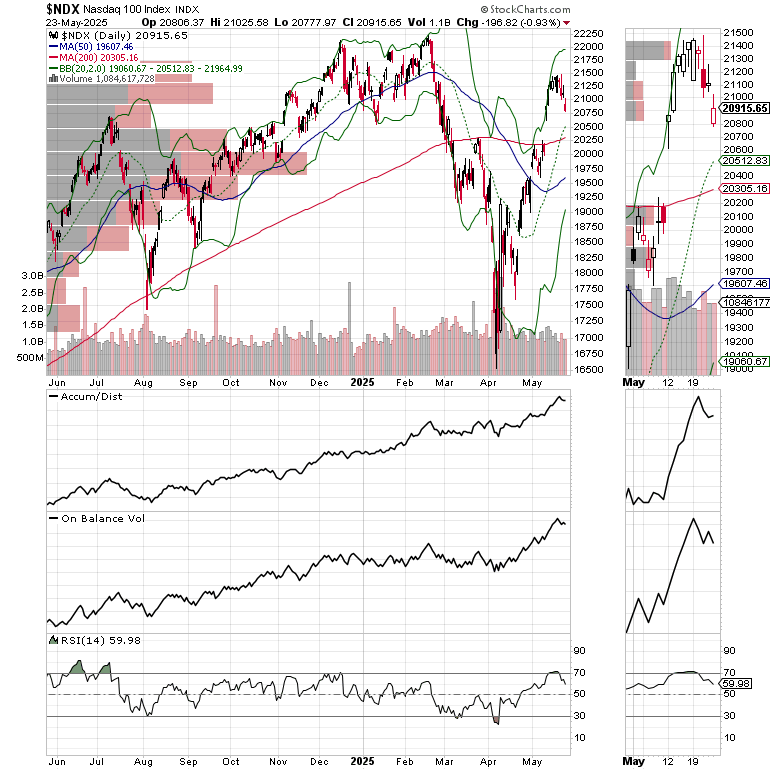
The Nasdaq 100 Index (NDX) failed to rise above 22,000, rolling over and could well test the 20-day moving average near 20,500. The RSI level of 50 is a key point to monitor as a break below that would signal a more aggressive loss of upward momentum.
The S&P 500 (SPX) closed below 5850 but held above its 200-day moving average. Still, a failure at these key support levels will likely trigger more selling.

For the definitive book on options trading, check out “Options Trading for Dummies”, now in its 4th Edition – Available Now!

#1 Best Seller in Options Trading –
Now in Audible Audiobook Format
Options Trading for Dummies (4th Edition) Audible Audiobook – Unabridged
Joe Duarte MD (Author), Terrence Kidd (Narrator), Tantor Audio (Publisher)