Will CPI Topple the Proverbial Apple Cart? Or Will the Seasonal Tendencies Win?
Is Santa Claus Already Saddling Up?
For stocks it’s now a battle between seasonality and liquidity with a CPI hurdle looming.
The months of November through January are a traditionally period for the stock market, as the so called Santa Claus rally revs up. And with the Federal Reserve in a rate cutting cycle, the odds of a year end rally should be well above average. The stock market seems to be signaling that such a rally has begun, although a bit of a rest is likely in the short term due to the recent rise. Still, after a quick pause, with the Fed’s easing coupled with a potential reversal in bond yields, we should get a whiz banger rally over the next few weeks.
That said, in the short term CPI may cause some bumps. Longer term (next year) much depends on fiscal policy, which means that the markets will be focused on the inevitable trial balloons from the new administration about how much money will be spent and where.
So, while the Fed lowered rates, as expected, it’s suddenly quiet about the “progress” it’s made on inflation. On the other hand, the bond market liked what it saw and heard from the central bank and the recent rise in T-bond yields may have made at least a short term top. Interest rate sensitive sectors are breathing a sigh of relief. But CPI is due out next week and a stronger than expected number could upset the apple cart.
Photo courtesy of Deviantart.com
Certainly, Fed Chairman Powell said all the right things during the post FOMC press conference as the U.S. Ten Year Note yield is looking top heavy after almost tagging the 4.4% yield. I have full details below.
In the end, the real question for markets is liquidity. And the Fed seems to agree but is clearly walking a tightrope as it doesn’t with to tip over the proverbial apple cart by juicing the markets too rapidly and reigniting inflation, which would raise bond yields. What’s most interesting is that the Fed seems to be in tune with the fact that, unlike in past cycles, the stock market is now an important cog in the economy. Therefore, the central bank doesn’t seem interested in causing a bear market. As a result, Mr. Powell is likely to continue his slow and steady path toward lower interest rates as he watches the apple cart carefully.
Liquidity is Neutral but Could Ease Soon
I’ve been writing about the market’s liquidity, for some time. I’m watching the National Financial Conditions Index (NFCI), carefully. This is a composite of 105 indicators which indicate how easy it is to borrow money. Lately, after falling for several weeks (a bullish sign), NFCI has begun to rise (a bearish situation). The rise in NFCI corresponded to the recent choppy trading pattern in the stock market.
The most recent reading of the index (November 1) once again ticked up. Inside the index, 10 measures were tighter than average while 95 were looser than average. And while that sounds encouraging, what’s troubling is that 57 measures tightened while 48 loosened. That’s a +9 balance for the dark side.
The next NFCI reading will be available next week. A return to the down side for the overall index will be bullish, especially if it’s accompanied by a reversal of the tighter than average/looser than average balance for individual components.
U.S. Ten Year Remains Above 4%. But Relief May Be on the Way
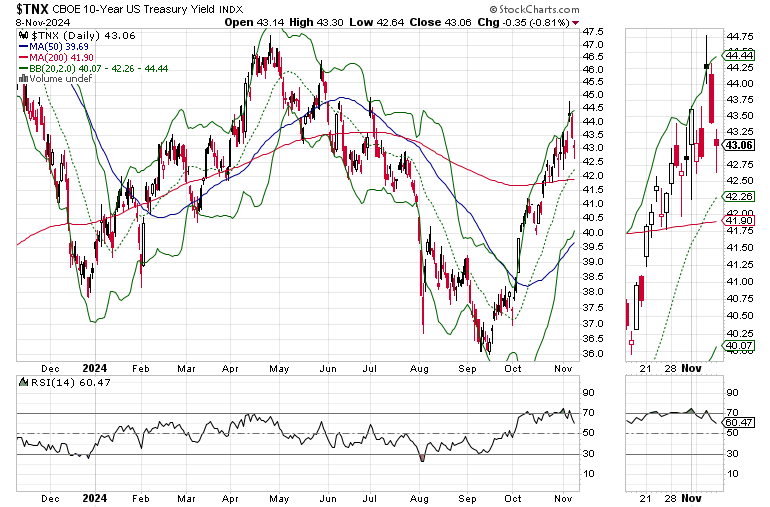
The U.S. Ten Year Note Yield (TNX) ended the week above 4%, but well off its recent high near 4.4%. And although the 200-day moving average for TNX is now support, TNX has been persistently overbought (RSI near 70) for a few weeks. In addition, its recent move above the upper Bollinger Band sets up a likely test of the 20-day moving average. A move below the 200-day moving average (4.2%) may send yields tumbling in a hurry.
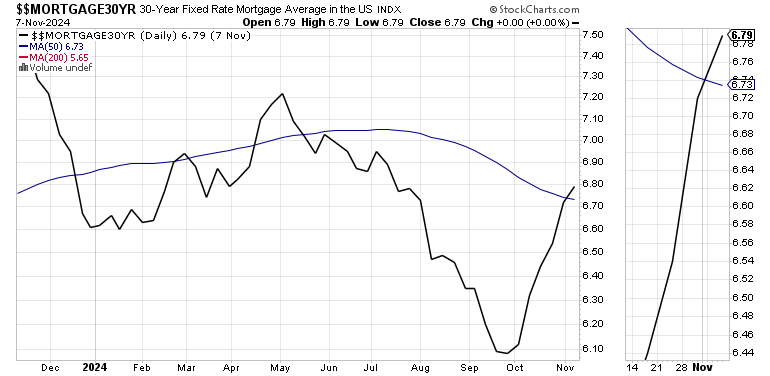
Mortgage rates remain near their recent highs, but should improve if bond yields remain on their downward trajectory. Get more details on this topic here. If you’re not getting my FREE weekly real estate and interest rate updates, you can sign up here.
If you’re an ETF trader, consider, Joe Duarte’s Sector Selector. It’s FREE with your monthly membership to Buy Me a Coffee. Sign up here. If you’ve been thinking about starting a day trading career, my new book “Day Trading 101” will get you started on the right foot. For short term intermediate momentum, and frequent option trades, visit the Smart Money Passport.
Bitcoin – Nearer to Closing the Deal
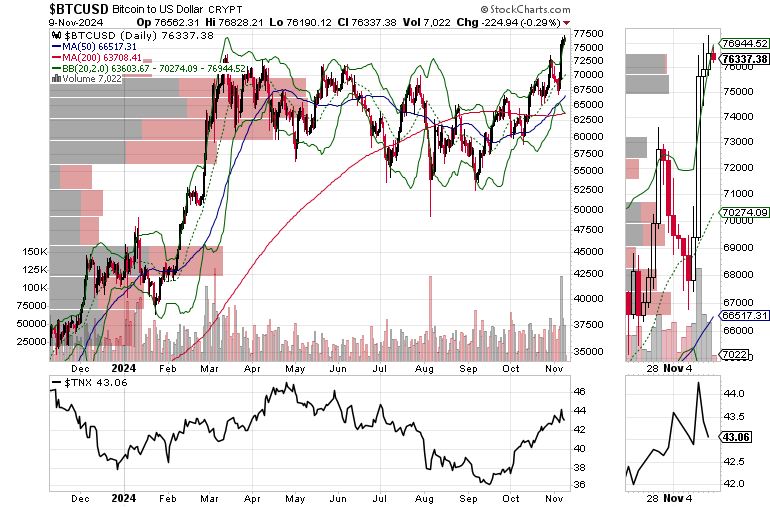
The elephant in the room in the financial markets these days is Bitcoin, which has quietly become a flight to safety asset. Moreover, it’s quietly testing the all important $75,000 barrier.
As the price chart shows, both the December 2023 to May 2024 and the more recent backup in the U.S. Ten Year Note yield (TNX) correspond to rallies in Bitcoin. Yet, as of 11/7/24, Bitcoin has continued its rally even as bond yields have fallen. That’s a sign that real money is moving into the cryptocurrency. I’ve recently added two Bitcoin related trades, which look poised to move decidedly higher along with BTC.
I’m Still Stuck on the Homebuilders.
The homebuilders are trying to recover after the recent drubbing brought on by rising bond yields. Brokerages have quietly downgraded some of them to Market Perform, while staying quiet about the rest of them. That’s actually a bullish development which suggests that the trendy money is walking away and that value players (I resemble that remark) are knocking on the door.
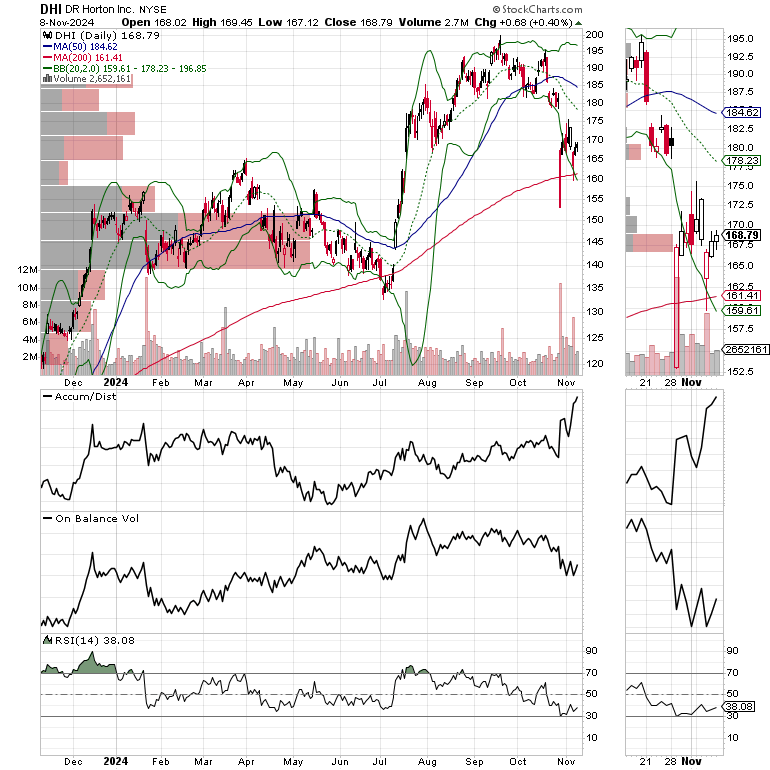
But here’s the thing. Supply and demand are still on their side. Moreover, even shares of the weaker ones in the sector, such as D.R. Horton (DHI) in which I still stubbornly own some shares, are starting to show small signs of recovery. Short sellers are now covering their bets (rising ADI) and the OBV line (value buyers) is flattening out. As a result, barring a nasty CPI related surprise, I will be adding some homebuilders to my Smart Money Passport Substack portfolios in the next few days.
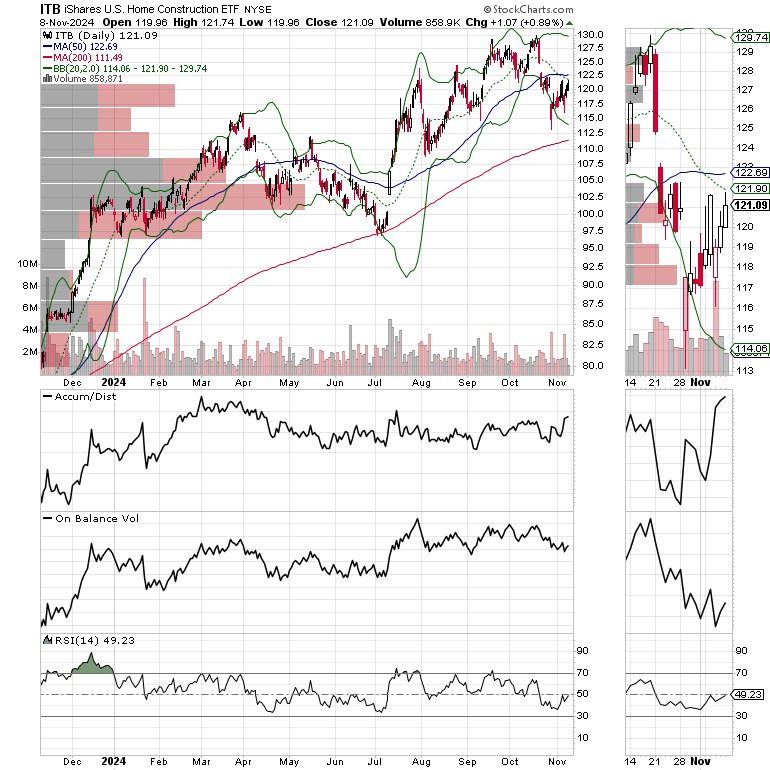
The iShares Home Construction ETF (ITB) is still in a sideways trading pattern, but not showing much spunk lately. A fall to the 200-day moving average is still possible. As I’ve noted lately, ITB is oversold, as the RSI is trading near 30. But given the recent action in DHI and GRBK, it’s a good idea to give this group some room for now.
AD Divergence Lessens.
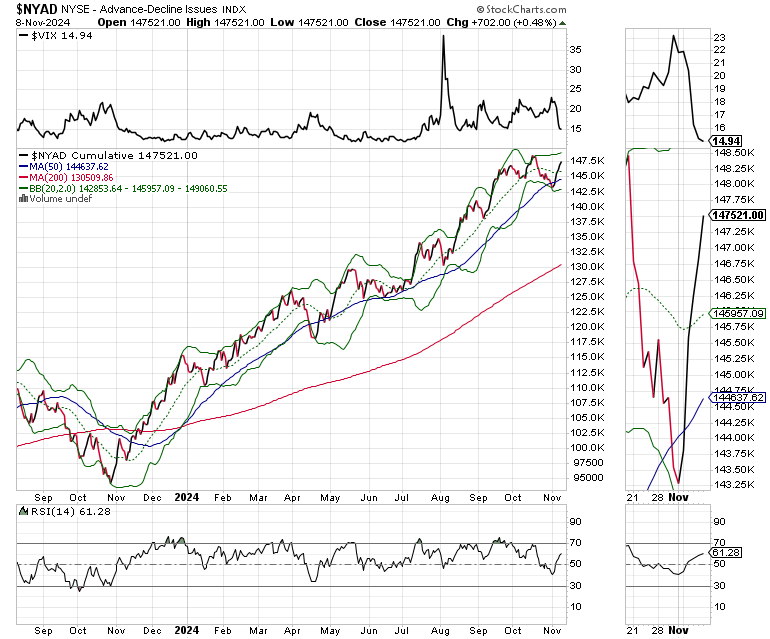
The New York Stock Exchange Advance Decline line (NYAD) is back above its 50-day moving average while the major indexes swelled to new highs. Thus, the negative divergence remains in place. And although this is cautionary, because NYAD is recovering, it’s only a minor divergence for now. However, a reversal in NYAD even as the indexes continue to move higher would be negative.
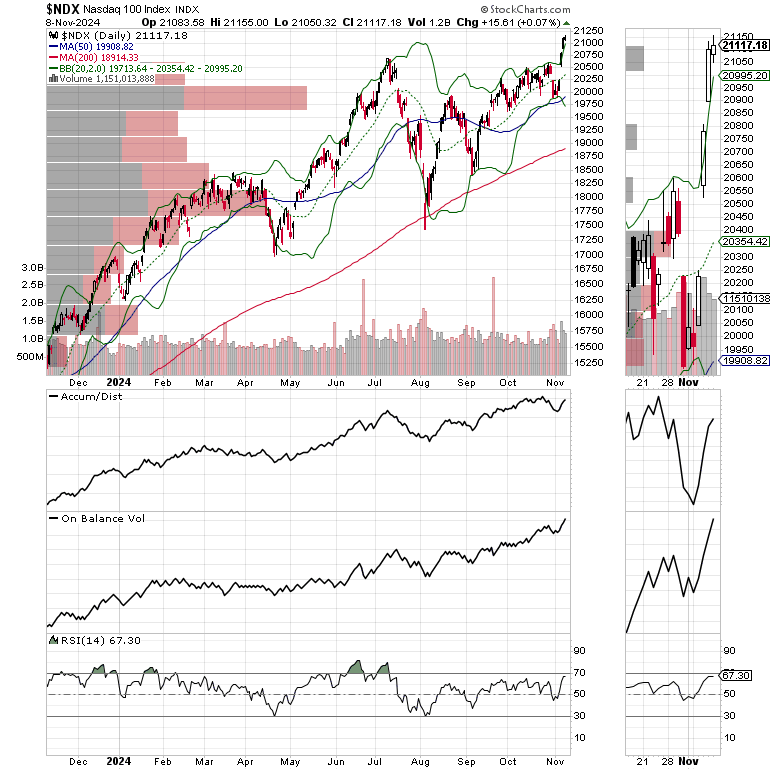
The Nasdaq 100 Index (NDX) made a new high last week with 20,000-20,500 (50-day M.A. and large VBP bar) now becoming key support.
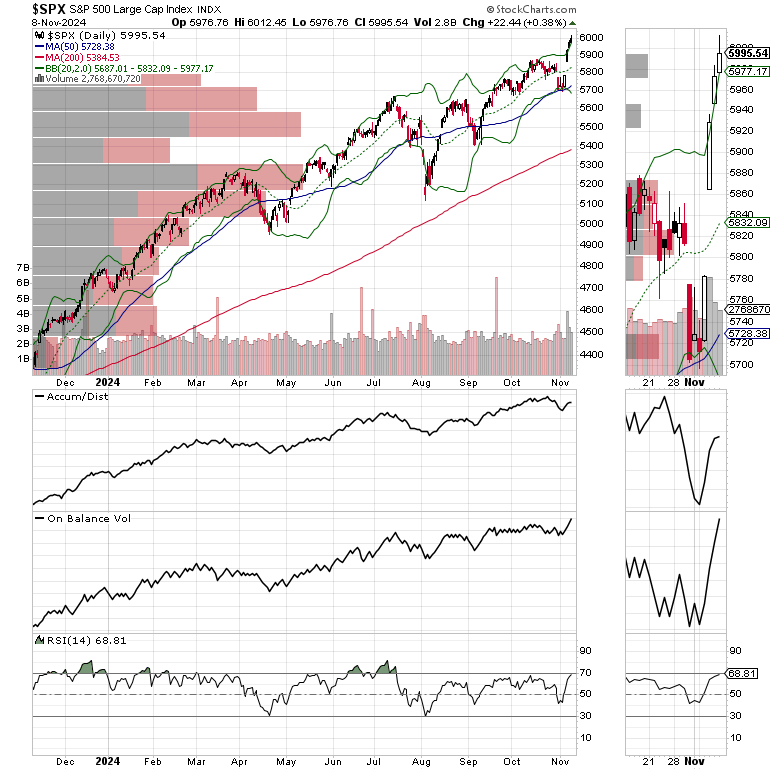
The S&P 500 (SPX) is knocking on the door of 6000. The 50-day moving average is support at 5700.
VIX Reverses and Heads Lower
The CBOE Volatility Index (VIX), is back below 20 as the market breathes a sigh of relief.
VIX rises when traders buy large volumes of put options. Rising put option volume leads market makers to sell stock index futures to hedge their risk and leads markets lower. A fall in VIX is bullish signaling lower put option volume, eventually leads to call buying which is bullish as it causes market makers to buy stock index futures raising the odds of higher stock prices.
To get the latest up to date information on options trading, check out “Options Trading for Dummies”, now in its 4th Edition – Available Now!
#1 Best Seller in Options Trading – Now in Audible Audiobook Format


For any1 interested, here are my Oct CPI estimates:
https://open.substack.com/pub/arkominaresearch/p/oct-2024-cpi-estimate?r=1r1n6n&utm_campaign=post&utm_medium=web
The new President aims to abolish the constitutional independence of the FED