


Was that the Bottom? Forget Bullishness and Bearishness. Become a Stalking Wolf.
Stay patient and keep that cash pile ready to pounce.

“Shape shift. Nose to the wind. Shape shift. Feeling I’ve been. Move swift. All senses clean” – Metallica.

Image courtesy of northernwilds.com
The market was feeling hopeless, especially given the way reliable indicators were screaming oversold without any reprieve. But since this time is different (yeah, I said it) to succeed, shed your bull or bear skin and become a stalking wolf. That means trade what you see and always keep your eyes and ears open.
Last week, I noted: “Given the pent up angst and pessimism that has accumulated during this decline, when market turns up, it will likely do so with the force of a tsunami. And as responsible traders we want to be ready for that event, while soberly weighing the risk/benefit ratio of any decision.”
The bottom line is that things went too far too quickly. Certainly, there are plenty of things to worry about. Thus, some selling was in order. Yet, given the way the market plunged, you’d think commerce was coming to a standstill, a conclusion which sent market sentiment gauges to extremely bearish levels setting up a rebound.
Here’s what I mean:
• The CNN Greed/Fear Index has delivered multiple readings below 20 in the past few weeks, signifying extreme fear. Yet, the market kept falling. On Friday, with the Dow up over 600 points, it closed at 21. This is bullish until proven otherwise. Yet in this “different” market, the bears could be right for longer.
• CPI and PPI came in below expectations, suggesting that inflation is finally stalling; yet bond yields failed to break to lower lows. This suggests fears about the dollar and inflationary pressures from tariffs.
• The major indexes have been oversold for days; yet, until Friday, when the market rallied, there hadn’t been a climactic rise in the Put/Call ratio; more on this below. This one is hard to explain.
• And the crown jewel: every time there is talk of tariffs stocks start a new wave of selling. How many times can tariffs hurt earnings?
In other words, we’re in a rare market where the bears have been right, and the bulls have gotten slaughtered even in the face of pervasive pessimism. Friday’s change was certainly encouraging. But if it doesn’t stick, we’ll be right back where we were.
But here’s where it gets interesting. As the market bottomed, on Friday, all throughout the trading day, the Put/Call ratio, especially for indexes rose. That’s a sign that institutional investors aren’t expecting the bounce to last. They may be right. Or they may be wrong. But I’ll say it again, major bottoms tend to develop when the Put/Call ratios and the CBOE Volatility Index soar.
Stay tuned. There’s more below and the Fed meets next week.
When will it be Over?
If you’re wondering if Friday marked the bottom, consider the following. We still haven’t seen a complete and irrational blowout in the CBOE Volatility Index (VIX) or the Put/Call ratio, although Friday’s intraday action was very encouraging on the P/C ratio. The index P/C ratio closed at a bullish 1.38. Sure, VIX has been climbing of late. But it’s still in the 20s, and every bounce in stocks reverses any prior gains on VIX. Big reversals usually follow P/C ratio readings above 1.1 or even higher, accompanied by blowout readings in VIX. Last Friday’s total P/C composite closed at 0.99 but was as high as 1.02 intraday - encouraging, but highly unclimactic.
The action in the options market suggests that the rally made big players more cautious. Here’s why that may be bullish. If stocks keep rising, those bearish institutional hedgers will have to cover their bearish bets and prices will rise further.
A Long Term Look at SPX Suggests this is Make or Break Time.
This is a good time to look at the very long term trading pattern of the S&P 500 as it is likely to provide a glimpse into the future.

To gauge the long term trading action, I look at the activity of an asset class as it trades between the Bollinger Bands (BB) anchored by the 200-day moving average (middle red line). That’s because when an asset rises above the upper BB or falls below the lower BB in this setup, it usually precedes a major reversal point.
The chart shows SPX rose above the upper BB in October, November and December of 2024, with each break leading to a retracement toward the 50 or 200-day moving average – a normal response known as a reversal to the mean. The eventual top in the index came when SPX lost momentum in March 2025 with subsequent breaches of the 50 and the 200-day lines. Currently, SPX is below its 200-day moving average, which suggests that, unless rapidly reversed, this down trend could move as far as the lower BB, somewhere near 5250 before turning up.
Adding complexity to the situation, we see that there is a three VBP bar cluster which spans 5450-5650 (trend lines highlight). This is an important support band which, if breached, would indicate that the downtrend could well extend to the lower BB. Furthermore, the RSI is at 30, which indicates a very oversold situation, indicating that if the support in this band holds, even if 5450 is tagged, then we could see a reversal to the 5650-5750 area where the 200-day moving average resides. What happens there will tell the tale of what comes next.
Bond Yields Are Stuck. U.S. Dollar Looks to Stabilize

Bond yields have hit a wall. The U.S. Ten Year Note yield (TNX) remained above its 200-day moving average but failed to rise above 4.3% as the better than expected CPI and PPI number calmed traders. Moreover, the RSI for TNX failed to rise above 50 on the recent upswing, a sign that upside momentum has stalled. The 50-day and the 200-day MA’s remain the keys to this market. A move above the 50-day would be negative. A break below the 200-day would be a positive.
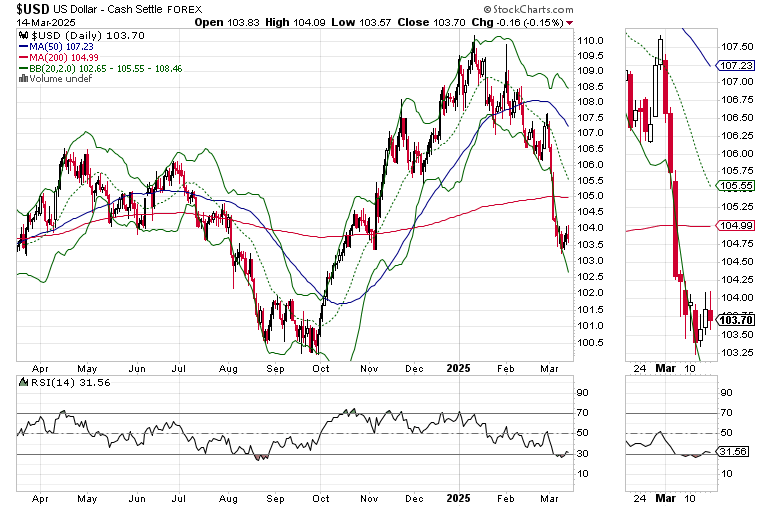
Meanwhile, the U.S. Dollar Index (USD) has broken below its 200 moving average, yet has found support near 103, while the very oversold RSI, and the reversal back inside the lower Bollinger Band suggests that at least a short term rebound is overdue.
In addition, liquidity tightened again last week. The Fed’s National Financial Conditions Index (NFCI) rose to -0.57 from its prior reading of - 0.59. Two weeks ago, it was at -0.67. Negative numbers signify ample liquidity. Yet, the 10 basis point rise over two weeks is cautionary and at least partially explains the general weakness in stocks.
Two Under the Radar Sectors - Natural Gas and Utility Stocks

The Natural Gas Index (XNG) is recovering, climbing above its 50-day moving average after its recent market related dip. I’ve been constructive on the pipeline companies for some time, owning some shares in my own account while recommending one of the best looking ones in the ESP portfolio for some time, while recently adding another excellent company to the Weekender portfolio recently. Certainly, owning stocks in the natural gas sector has required some patience. But that may be about to pay off as the Dept. of Energy is starting to move toward expanding pipeline capacity in the Northeast U.S.

Another sector which has shown some relative strength during the selloff has been the utilities. The Utilities Select Sector SPDR Fund (XLU) has been moving sideways as the market has collapsed. Utilities offer another way of playing the potential expansion of the natural gas sector.

Finally, of interest is the action in the Gold & Silver Index (XAU), which is on its way to test its recent highs near 175. A lot of what happens in XAU depends on the dollar. Just in case, I’ve just added a new silver stock, and several natgas stocks to the Weekender Portfolio.
If you’re an ETF trader, consider, Joe Duarte’s Sector Selector. It’s FREE with your monthly membership to Buy Me a Coffee. Sign up here. If you’ve been thinking about starting a day trading career, my new book “Day Trading 101” will get you started on the right foot. For steady gainers, check out the Smart Money Weekender Portfolio. I’ve just added several new positions in this weekend’s edition. Trade better and longer with more energy and vigor. Visit my Health Page and receive one Free Bonus Month to your Smart Money Passport subscription with your first purchase.

NYAD Recovers. Has Overhead Resistance to Deal With.
One step at a time. The New York Stock Exchange Advance Decline line (NYAD) found support above its 200-day moving average, but now has to deal with resistance at its 50-day moving average. To its credit, NYAD has so far held above lows seen in August, December and January.

The Nasdaq 100 Index (NDX) remained below its 200-day moving average but held its ground near 19750, the last major support level before selling becomes more aggressive. A failure to hold above 19500-19750 could lead to a test of 18,000-18,250 before any meaningful rebound takes hold.

The S&P 500 (SPX) held above 5450. Key resistance is at the 200-day moving average. See the chart above for more details.
VIX Stalls
The CBOE Volatility Index (VIX) fell below 22. This is an improvement.
VIX rises when traders buy large volumes of put options. Rising put option volume leads market makers to sell stock index futures to hedge their risk and leads markets lower. A fall in VIX is bullish signaling lower put option volume, eventually leads to call buying which is bullish as it causes market makers to buy stock index futures raising the odds of higher stock prices.
To get the latest up to date information on options trading, check out “Options Trading for Dummies”, now in its 4th Edition – Available Now!

#1 Best Seller in Options Trading – Now in Audible Audiobook Format