


Stealth Money Alert as Contrarian Bones Stir. Patience Will be Rewarded.
How to invest after a market selloff.

Patience is a virtue, while being a contrarian stock trader often pays off handsomely. The two go hand in hand. This is a good time to test our skills in both.
I’m seeing a familiar trading pattern unfold. And if it behaves as it has over the last eighteen months, the bottom is closer than the majority expects. On the other hand, if it doesn’t hold, we could be in for a lot more selling.

Patient man image courtesy of https://i.pinimg.com.
The Perfect Storm
The market’s recent mini-crash was preceded by a perfect storm as stocks were overbought ahead of the recent FOMC meeting while the market’s sentiment was well beyond exuberant. Mr. Powell suggested that inflation was spooking the Fed and that we may see a slower pace of interest rate cuts over the next few months. So, stocks fell.
We know this is how it works. What’s more important is to manage portfolios accordingly as the panic selling unfolds and to gauge if and when it makes sense to buy stocks which are providing value. We may be in the early stages of one of those periods when it’s good to swim a bit upstream and buy a few shares here and there.
Specifically, what fuels patience is an understanding of how the market may proceed in the next few weeks while having reasonable contingencies in place for each possibility. Consider the following:
• Stocks may recover and move decidedly higher for several weeks fueled by short covering and eventually fear of missing out (FOMO);
• Stocks may enter a trading range; or
• The current bounce fails and stocks make a second and perhaps lower bottom or even a series of bottoms. In this scenario, the lowest bottom would likely be a frightening selloff fueled by true panic as the current rally fails. The telltale signs of a panic bottom are lower volume, more drama, and a higher reading in the RSI than the previous bottom readings, especially in the NYAD (see below).
As investors, we should be prepared for all possibilities by following these simple principles:
• Stay patient and aware of what’s happening in the markets;
• Stick with what’s working;
• Hold onto any position that is not stopped out. And most of all;
• Look for relative strength, build a shopping list and retool portfolios for the next up trend.
A perfect example of this strategy is evident in my recent Weekender Portfolio pick, which is quietly flying under the radar and being steadily accumulated by stealth money .
How to Invest After a Market Selloff
Stealthy, savvy traders sneak into stocks after big selloffs. Of course, there are no guarantees, but following the smart money into stocks after a market pullback often makes sense.
First, look at the sectors of the market which withstood the selling. These are areas where patient investors haven’t lost confidence. These sectors often pick right up where they left off and continue rising.
A perfect example is information technology as in the Vanguard Information Technology ETF (VGT). This ETF which houses large cap and media related stocks pulled back to its 50-day moving average where the buyers were waiting and bought the dip. Two of the best looking stocks in this ETF are long term holdings of the Weekender Portfolio. I often include short term trades from sectors which are mirroring this type of performance in the Smart Money Passport.

A second useful strategy is to focus on sectors which are on the verge of breaking out, such as the VanEck Vectors Semiconductor ETF (SMH), which focuses on semiconductor stocks. Most recently, as the market was selling off, SMH continued its consolidation pattern, retaining the potential for a breakout with the $260 area being the last resistance level before what could be a significant advance.

A third approach is to look for sectors that are so beaten down that they have little choice but to eventually rise. A perfect candidate is the homebuilder sector, as in the iShares U.S. Home Construction ETF (ITB), whose shares were aggressively sold based on the fear of rising interest rates.
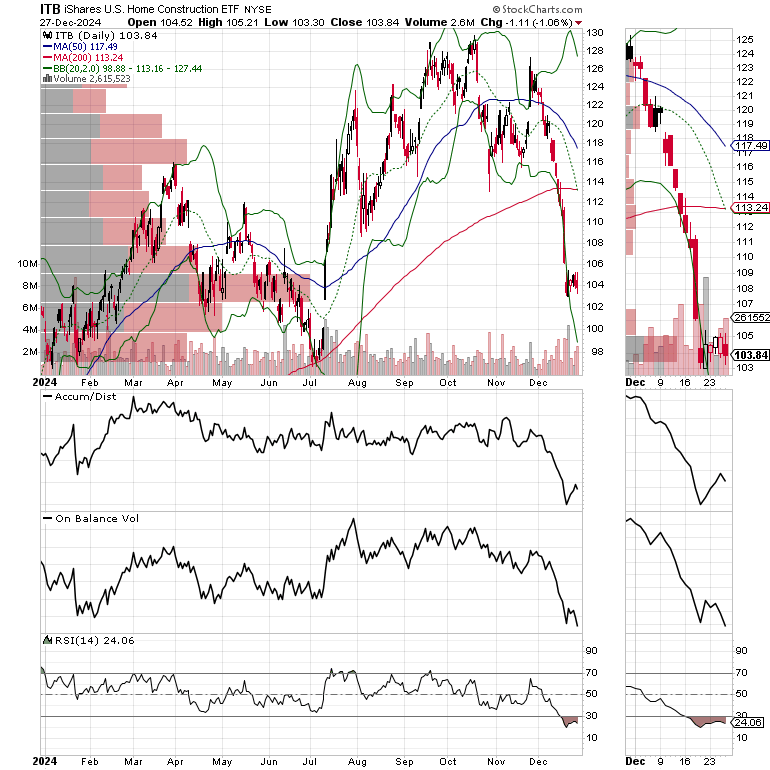
ITB is so oversold that anyone with a time horizon of at least twelve months should consider dollar cost averaging into it. Note the RSI level fell into the teens during the selling. That type of reading indicates that this ETF is likely the most oversold it will be in years. Note that both the ADI and OBV lines are starting to bounce higher, as short sellers (ADI) begin to cover positions and vulture value investors (OBV) start to nibble at the grossly oversold shares.
Ten Year Yield Breaks Above 4.5%.
Bond traders have not recovered from Powell’s inflation comments. As a result, the U.S. Ten Year Note yield (TNX), the benchmark for the average 30 year is above the key 4.5% yield, closing above 4.6%, and seemingly headed for 4.75%.

Liquidity Flattens Out
Liquidity, the ease with which money travels through the financial system is the key to bull and bear markets. When liquidity is ample, markets tend to rise. When liquidity is scarce markets don’t do well. The Federal Reserve’s National Financial Conditions Index (NFCI) is a readily available tool which indirectly shows us the state of liquidity in the markets.
A decline in the weekly NFCI number indicates that the ease with which money can be borrowed is rising. Last week, NFCI was unchanged, a sign that conditions are stable but are not improving further for now. This remains bullish, but is also a bit cautionary, because the lower the number goes, the higher the liquidity level in the financial system.
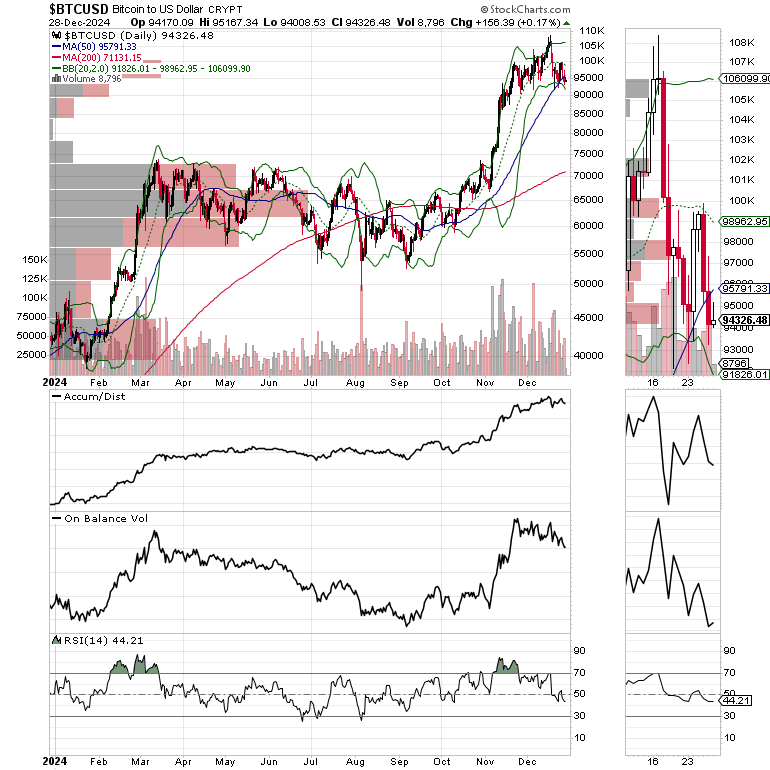
Bitcoin is in Danger of Falling Further. The Next Buyable Dip Will Come.
Bitcoin (BTCUSD) slipped below its 50-day moving average, and could move decidedly lower. Both the ADI and OBV lines are drifting lower suggesting that selling pressure is building. The good news is that eventually BTC will stabilize and a new dip buying opportunity will be evident.
We were stopped out of our Bitcoin position with a nice profit and are waiting for the right setup to get back in. If you’re an ETF trader, consider, Joe Duarte’s Sector Selector. It’s FREE with your monthly membership to Buy Me a Coffee. Sign up here. If you’ve been thinking about starting a day trading career, my new book “Day Trading 101” will get you started on the right foot. For steady gainers, check out the Smart Money Weekender Portfolio.

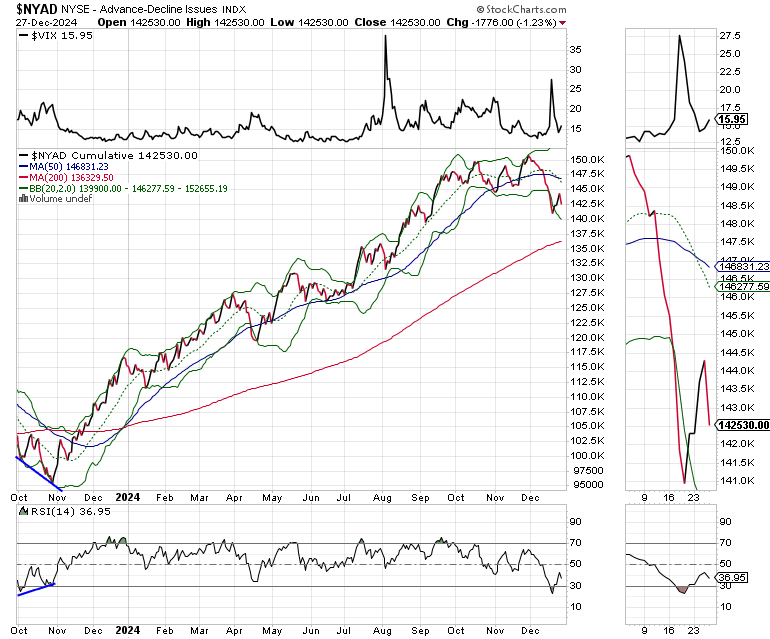
A Possible Test of the Recent Lows May be in the Works.
The New York Stock Exchange Advance Decline line (NYAD) is slowly recovering after its recent oversold reading of 30 on the RSI indicator which corresponded to its holding at support which went back to August 2024. NYAD looks set to test its recent support. The key to what’s next is what happens with the RSI during a new low on NYAD as we saw in October 2023 (blue trend lines).
The Nasdaq 100 Index (NDX) successfully found support at 21,000-21,250 and its 20-day moving average Mega cap tech stocks continue to lead the way.

The S&P 500 (SPX) break below 6000 level as short lived, as support at its 50-day moving average held. The next challenge is for the index to stay above its 20-day line and build upon that as it challenges its recent highs. A move above 6100 would likely take SPX significantly higher.

VIX Ends Week Below 20
The CBOE Volatility Index (VIX), remains below 20 as bearish sentiment cooled off.
VIX rises when traders buy large volumes of put options. Rising put option volume leads market makers to sell stock index futures to hedge their risk and leads markets lower. A fall in VIX is bullish signaling lower put option volume, eventually leads to call buying which is bullish as it causes market makers to buy stock index futures raising the odds of higher stock prices.
To get the latest up to date information on options trading, check out “Options Trading for Dummies”, now in its 4th Edition – Available Now!

#1 Best Seller in Options Trading –
Now in Audible Audiobook Format
Options Trading for Dummies (4th Edition) Audible Audiobook – Unabridged
Joe Duarte MD (Author), Terrence Kidd (Narrator), Tantor Audio (Publisher)
4.5 out of 5 stars
#1 Best Seller in Options Trading