


SPX Cracks 5000. Where are the Fireworks?

What’s going on? The S&P 500 index (SPX) finally cracked the 5000 barrier. So where are the fireworks and the popping champagne corks? Sure, there were muted headlines noting the event on CNBC and Bloomberg, but nothing to compare to the craziness that unfolded at Dow 10,000, or other round number milestones. There was no mention of the development on the Wall Street Journal’s website when I checked toward the end of the day as the new highs unfolded. Indeed, the story has been mostly buried.
This is a head scratcher.
On the one hand, the lack of outward exuberance may be a bullish sign as major tops are often defined by unbridled optimism. On the other hand, traditional sentiment measures, such as the CNN Greed Fear Index, which recently registered at 77, are already well into readings which often signal major market tops. For its part, the CBOE Volatility Index remains subdued, which suggests that fear remains for now. Meanwhile, the market’s breadth (see NYAD analysis below) is within reach of confirming the new SPX high, but can’t seem to quite get there.
It would certainly be nice to see the New York Stock Exchange Advance Decline line kick things into high gear and make a proper new high. So, even though I don’t want to rain on anyone’s parade, as I said here last week, it’s a good time to be ready for anything. My conclusion is that the only way to trade this market is to stick with what’s working, until it stops working, while keeping a very close eye on the exit.
Bond Yields Hold the Key
The stock market grabs the headlines, but the bond market sets the tone. That’s because the global economy runs on debt and the Fed’s higher for longer interest rate hikes have made it difficult to borrow money and to get things done. In other words, global commerce has slowed significantly, and company earnings have been unpredictable.
Moreover, companies are starting to tighten their belts more aggressively via increasing layoffs. You can see a thorough analysis of what the private data is saying about the jobs market, here.
Last week, a very subtle thing occurred. The U.S. Ten Year note yields (TNX) quietly rose above its 200-day moving average and the 4.1% area, which had been resistance is now acting as support. This subtle occurrence may be a signal that bond traders are losing their patience with the Fed and that another round of bond sales is about to be unleashed, like what happened from April to October in 2023.

If that happens, the odds of a sustained rally above SPX 5000 are likely to be significantly reduced.
Where Money is Flowing
Selectivity is the key to success in this market, which is why it’s important to review individual sectors displaying both rising and falling trends. In conjunction with the bearish turn in bond yields, the traditional interest sensitive bellwether for stocks, the utility sector is also near an important decision point.

The Utilities Sector SPDR ETF (XLU) is testing short term support near $60, having already failed to rally above its 50 and 200-day moving averages recently. The Accumulation/Distribution indicator (ADI), indicator is trying to bounce, suggesting that short sellers are abandoning positions. On the other hand, the OBV line is tipping over, suggesting sellers are overtaking buyers. If bond yields rise, look to utilities falling further, and whether the event spreads to the rest of the stock market.

Meanwhile, happy days are here again for the Invesco QQQ Trust (QQQ), which remains in an impressive momentum run fueled by strength in the usual suspects, NVDIA (NVDA), Microsoft (MSFT) and by the fledgling bounce in Apple (AAPL).
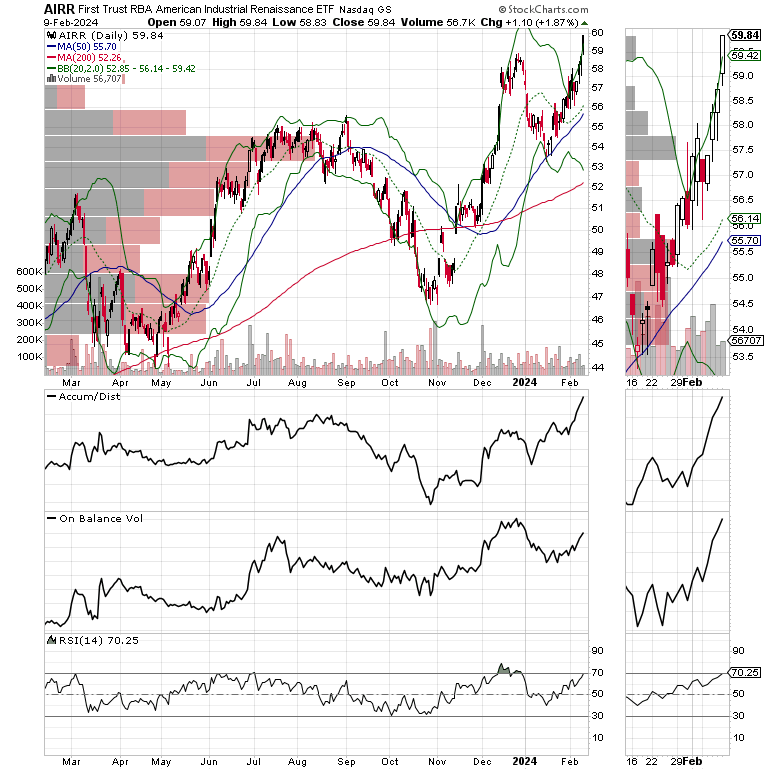
Finally, money is flowing into construction and engineering companies. The First Trust RBA American Industrial Renaissance ETF (AIRR) just broke out to a new high behind solid money flows, as evidenced by a rise in both ADI and OBV. I recently recommended an engineering firm which is poised to move higher. You can check it out with a Free Two Week trial to my service, here.
A Practical and Balanced Approach
When markets reach all-time highs, risks rise as traders can become euphoric and markets can fall precipitously as the enthusiasm becomes unmanageable. Therefore, during these periods in the market, risk management is the prime directive for investors. And while there is no reason to sell everything, all at once, individual portfolios should be prepared for both a rise or a fall in stocks. Therefore, keep these factors in mind:
· Stick with what’s working; if a position is rising in price or holding up better than the market – keep it;
· Raise cash by reducing position size while maintaining exposure to strong stocks;
· Shorten your time horizon with smaller, targeted trades;
· Consider short term hedges such as put options and inverse ETFs. These could soften the blow if the Fed spooks the markets;
· To reduce risk of loss, consider trading options instead of stocks;
· Look for value in out of favor areas of the market that are showing signs of life but build positions slowly; and
· Protect your gains with sell stops and keep raising them as prices of your holdings rise;
· Finally, some level of hedging seems advisable.
NDX and SPX Deliver Highs. Market Breadth Still Holds Back.
The NYSE Advance Decline line (NYAD) is within reach of making a new high, but has yet to confirm the new highs on the major indexes. This may be a sign of trouble for the stock market. And while this slight divergence is unfolding, the good news is that it can be easily corrected by one or two bullish days. So, for now, we’ll give the market the benefit of the doubt, although it’s hard to see this situation remain in place for an extended period.

The Nasdaq 100 Index (NDX) made yet another new high, as Microsoft and Amazon moved higher. Both ADI and OBV lines for NDX remain bullish. Let’s see what the market does if NDX goes above 18,000.

The S&P 500 (SPX) finally broke above 5000, with relatively little fanfare. We’ll see what happens next.

VIX Remains Below 15
The CBOE Volatility Index (VIX) remained below 15. This, for now, remains a bullish factor for stocks. If VIX remains subdued more upside is possible.
A rising VIX means traders are buying large volumes of put options. Rising put option volume from leads market makers to sell stock index futures to hedge their risk. A fall in VIX is bullish as it means less put option buying, and it eventually leads to call buying which causes market makers to hedge by buying stock index futures raising the odds of higher stock prices.
To get the latest up to date information on options trading, check out “Options Trading for Dummies”, now in its 4th Edition – Available Now!
#1 Best Seller in Options Trading –
Now in Audible Audiobook Format
Options Trading for Dummies (4th Edition) Audible Audiobook – Unabridged
Joe Duarte MD (Author), Terrence Kidd (Narrator), Tantor Audio (Publisher)
4.5 out of 5 stars
#1 Best Seller in Options Trading