


Contrarian Surprise: Stealth Liquidity Could Boost Stock Prices Despite Trade Related Volatility.
The deceptive truth behind the new world and the dip buying we’re seeing.

The building blocks of a big upside surprise are stacking up as liquidity sneaks higher and the dip buyers nibble at stocks on every downtick triggered by bad news. You have a choice. You could fret about the headlines, or you could tune in to what the price charts are saying and get in tune with the times.
What’s Happening Underneath the Surface
Maybe you haven’t noticed. But it seems that every time a new tariff headline comes in and the market tanks, the dip buyers appear. Yet, all you hear about is the price drop and the doom and gloom. No one talks about stealth buying. Yet, someone’s quietly buying the dips, which begs the questions, who and why?

Image courtesy of storyblocks.com
The truth is that this type of trading pattern suggests that someone is preparing for when conditions line up just right (some sort of “unexpected” pleasant surprise), and stocks erupt in a “surprise move” to the upside with the 6000-6100 area being the key resistance level. A sustained move above this key price range could take the index significantly higher.
What makes this most remarkable is that despite clear indications of its possibility in the price charts, almost no one believes that it could happen. Yet, there it is for all to see – dip buyers come in on weakness every time.
Does that mean that we’re going higher? No one knows. But to ignore the possibility and to be unprepared for it could cost you money, especially if the sudden rise in negative rhetoric turns into yet another White House deal and a reprieve for China.
It Could be an Interesting Summer
So where are we? Well, if the action on Friday is any hint of what may lie ahead, it looks as if the trade/tariff vibe is heading for a new level of operation. Whatever it is means little to those of us who have no control over events. Yet, with the most recent PCE reading coming in lighter than expected (inflation is nearing the Fed’s 2% target) and jobless claims inching up, the Fed may be forced to openly ease – sooner than later. That would be on top of the stealth easing, as I describe below, that’s already under way.
From a practical standpoint, the longer prices consolidate, and the more the dip buyers materialize with each installment of bad news, the higher will be the odds of something positive coming out of nowhere and triggering a monumental short squeeze.
Be prepared.
Why Would Stocks Rally?
The simple answer is liquidity has improved. Make no mistake about it, the amount of money in the financial system which could be deployed into stocks is rising, thanks to the Fed. I offer the full details below. But suffice it to say that financial conditions are back to where they were in February, which was a very bullish number.
So, where is the money coming from? The Federal Reserve is quietly buying bonds (which is almost as good as QE), improving liquidity in the system, and giving dip buyers fuel for buying. Kudos to Garret Baldwin at the Money Printer Substack for beating this drum loudly.
Looking at the Big Picture and the Dip Buyers
For better or for worse, the world is operating under a new set of rules based on evolving trade patterns. This evolution has transformed the flow of investor money into several sectors which are all held together by one factor: technology and its effects on everything else. And it’s not just AI. It’s electric cars, communications, connectivity and the redrawing of the map on energy, electricity, and infrastructure. In other words, we are living through transformative times, which require adaptive thinking and analysis.
Perhaps the most important aspect of trading the Big Picture is to know when to buy dips. The key, as I will describe below, is to pinpoint key support levels and to monitor prices when they fall to them.
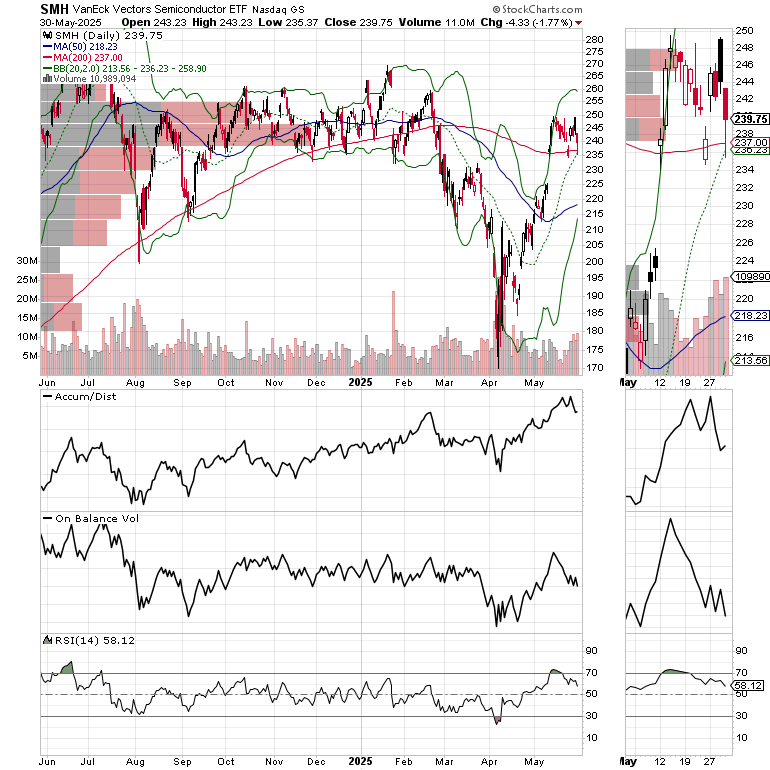
The seminal sector is that of semiconductors (SMH). That’s because many things that were driven by valves, nuts and bolts, are now operated via electronic brains, with AI thrown in for further effect. Therefore, a lack of investment in semiconductors is likely to be detrimental over the next few years. And the dip buyers know this. Note how over the last few weeks, every time SMH has fallen to the $235 area, they’ve stepped in to buy. Also note the confluence of important support levels at $235; a large VBP bar, the 20-day moving average, and the 200-day moving average.

Semiconductors need a language through which to operate, which is why software stocks (IGV) are also worth considering, although software investing is a bit more nuanced than straight semiconductor related investing. Nevertheless, note the similar trading pattern in IGV compared to SMH with the confluence of support levels mirroring that of SMH.
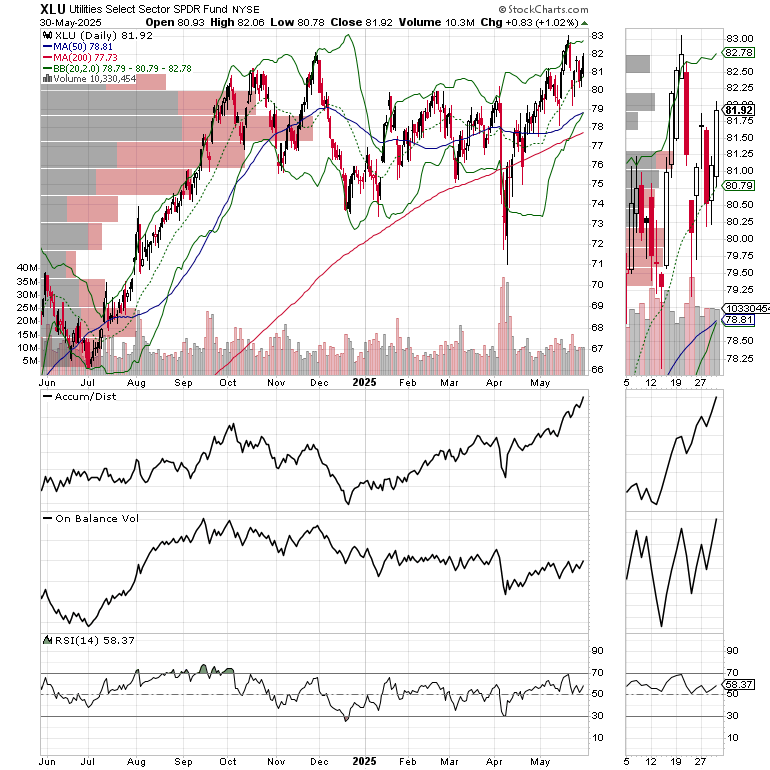
Finally, all this technology requires electricity, which is why the utility sector continues to hold up and could be setting up for a breakout. Again note that the recent dip in XLU coincided with a test of multiple support levels (20,50, 200-day moving averages and VBP bars near $78). Incidentally, ETF sector investing anchors our Sector Selector Portfolio, where XLU is a central holding, which can be a useful addition to your retirement investment research for your 401 (k) or self-directed IRA. I own shares in XLU.
Bottom line:
The world has changed. Traditional trade and geopolitical relationships are changing. The new race for global dominance is based on evolving technology. AI grabs the headlines, but other areas of technology and related support services are equally important. The stock market’s volatility, by creating a climate of fear among investors, is masking the underlying reality. Indeed, the changing trade and geopolitical landscape has changed the flow of money into technology and related sectors, especially that of power generation and hardware support. The smart money is using intraday volatility caused by tariff and trade related headlines as an opportunity to buy into central sectors of the new dynamic.
Liquidity Watch – Liquidity Rebounds Giving Stock Market a Boos
Liquidity improving and the stock market is likely to benefit. The latest reading, May 23 , 2025, of the Fed’s National Financial Conditions Index (NFCI) came in at -0.61 compared to last week’s -0.58. Indeed, the liquidity environment is now almost where it was in February. Still, it’s a plus. Negative numbers signify ample liquidity. Yet, the nearly 10-plus basis point rise over four weeks is cautionary and at least partially explains the general weakness in stocks.
Sentiment Summary – Greed Readings are Worth Watching
The CNN Greed/Fear Index (GFI) closed last week at 62, retracing from its recent Extreme Greed readings. This indicator needs to decline further to rebuild the wall of worry required to push stocks higher.
The Composite Put/Call Ratio closed at a neutral reading of 0.89. The index P/C ratio closed at 1.23. Both indicate that investor fear, and the fuel for a short squeeze are in place.
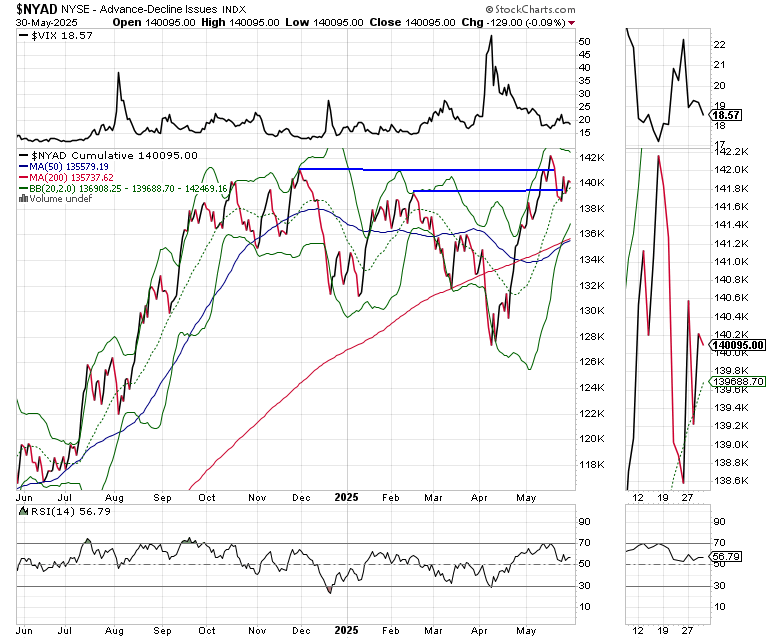
The CBOE Volatility Index (VIX) closed at 18.57, falling back below 20 and disagreeing with the above chronicled Put/Call ratios. This is a bullish divergence. VIX rises when traders buy large volumes of put options. Rising put option volume leads market makers to sell stock index futures to hedge their risk and leads markets lower. A fall in VIX is bullish signaling lower put option volume, eventually leads to call buying which is bullish as it causes market makers to buy stock index futures raising the odds of higher stock prices.
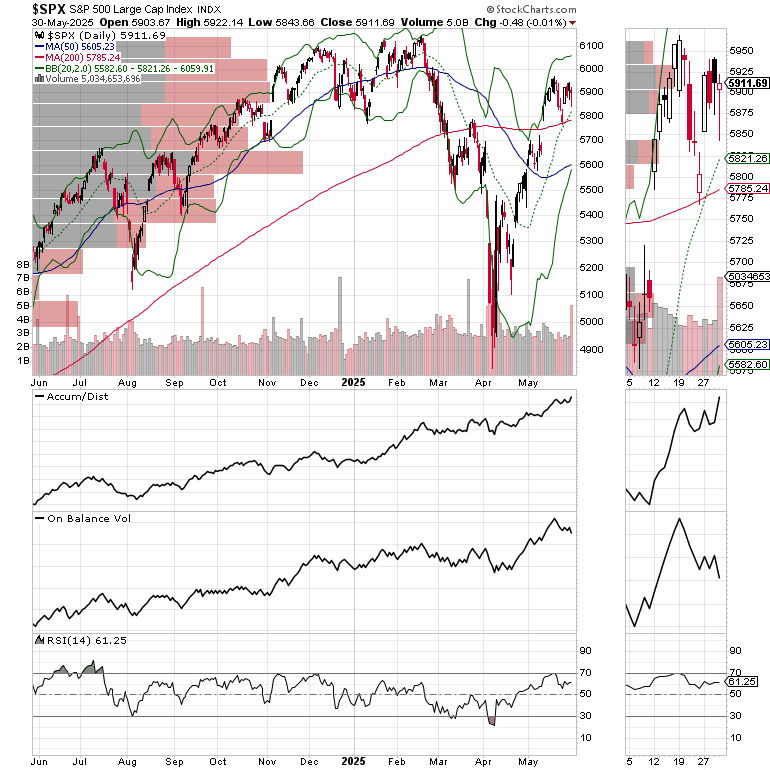
The S&P 500 (SPX) once again found buyers near 5850. A move above 6000 almost assures a retest of the recent highs.
The U.S. Treasury bond remains range bound.
Bond Yields Reverse at Top of Trading Range
The bond market remains range bound as traders gauge the uncertainty of the evolving trade issues and the fiscal issues in Congress clash with the apparent slowing in inflation.
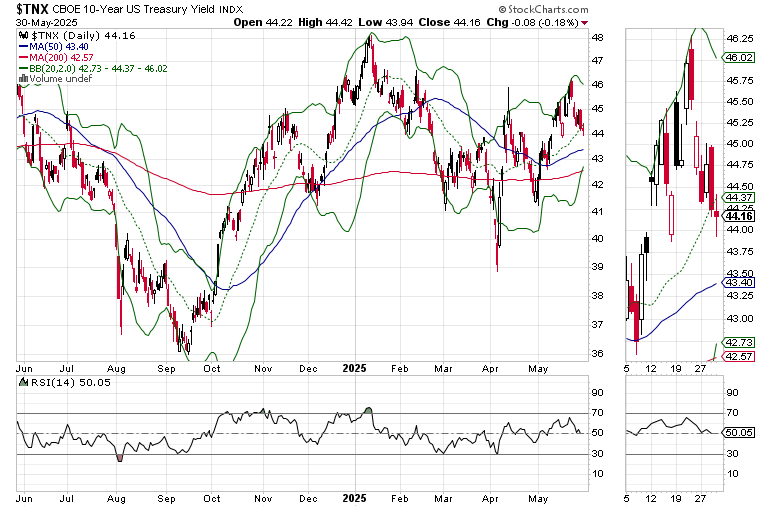
The U.S. Ten Year Note yield (TNX) is still trading between 4.3 and 4.6.25% with the 200-day moving average providing support.

If you have a 401(k) plan that offers ETFs as investing vehicles, consider Joe Duarte’s Sector Selector. It’s FREE with your monthly membership to Buy Me a Coffee. Sign up here. If you’ve been thinking about tuning up your investment playbook, my new book “The Everything Guide to Investing in Your 20s & 30s” will get you started on the right foot – pre-order now. For those wishing to get started on day trading, consider “Day Trading 101.” For steady gainers, check out the Smart Money Weekender Portfolio. I’ve just added several new positions in this weekend’s edition. Trade better with extra energy, and vitality. Visit my Health Page.
NYAD Bends but Doesn’t Break
The New York Stock Exchange Advance Decline line (NYAD) had some intraday volatility several times last week. By week’s end NYAD had closed above its 20-day moving average while the RSI closed just above 50, showing a steadying trend. A failure at the 20-day and a break below 50 on RSI will likely trigger more selling.
The Nasdaq 100 Index (NDX) found support just above 21,000 but failed to rise above 22,000. Still, this keeps the bulls on their toes. The RSI level of 50 and the 200-day moving average are key points to monitor as a break below them would signal a more aggressive loss of upward momentum.

The S&P 500 (SPX) managed to hold near 5850 and above its 200-day moving average. This keeps the bulls’ hopes alive.
For the definitive book on options trading, check out “Options Trading for Dummies”, now in its 4th Edition – Available Now!

#1 Best Seller in Options Trading – Now in Audible Audiobook Format
Options Trading for Dummies (4th Edition) Audible Audiobook – Unabridged