Contrarian Alert: High Fear, Excellent Money Flows. That’s Usually a Bullish Scenario.
The Wall of Worry is Back. Is an Upside Surprise Around the Corner?
Image courtesy of Getty images.
Are you biting your knuckles, worrying about the stock market? You’re not alone. There’s plenty to be anxious about. Yet, in the markets, history shows that when everyone is bearish and stocks keep rising, it’s a sign that prices are climbing a wall of worry. Walls of worry are usually bullish.
It’s hard to be bearish, on stocks, when the New York Stock Exchange Advance Decline line (NYAD) is within a hair’s breadth of a new high. And yet, many people are bearish. So, you get the feeling that things could go south in a hurry at any time. Yet, that’s the classic wall of worry dynamic, a market with excellent potential and simultaneously high levels of fear and concern.
You know the reasons for why people are bearish. They are real and meaningful. But during times like these, from a trading standpoint, it’s best to focus on money flows and market sentiment, as I noted in my recent appearance on Jason Perz’s “Against All Odds” podcast.
The Tenets of Successful Trading
The central tenet of successful trading is keeping things simple. Specifically, knowing how the markets work and the ability to consolidate information in a way that is easily accessible and immediately useful.
Keeping it simple came in handy last week. On Wednesday, CPI threw a wrench into the bond. But on Thursday, the less aggressive rise in PPI was good enough to push bond yields to new for the current short term cycle (full details below). What mattered most to the trading crowd was the most recent data, which pushed stocks higher.
So, while Wednesday was a tough day, by Thursday things were better. My point is that there is nothing simpler than trading in the moment and keeping up with what happens in the bond market.
Moreover, following the money and adapting to circumstances are also important tenets. Thus, if you dwelled on Wednesday’s tough market, you might have missed Thursday’s rebound.
Finally, it’s important to have an indicator which helps you cut through the clutter. That’s why I focus on the New York Stock Exchange Advance Decline line (NYAD, see below for full details). The take home message is that NYAD filters out a great deal of noise and offers you an actionable window into the stock market.
It doesn’t get much simpler than the NYAD. When it’s rising, it tells you that more stocks are rising than falling. When it’s falling it reveals the opposite. The bottom line is that a rising NYAD means that the odds of picking winners is higher than when it is a falling.
The bottom lines is that as a trader, there is no point in taking chances when the odds are against you.
Bond Yields End the Week Below Key Support
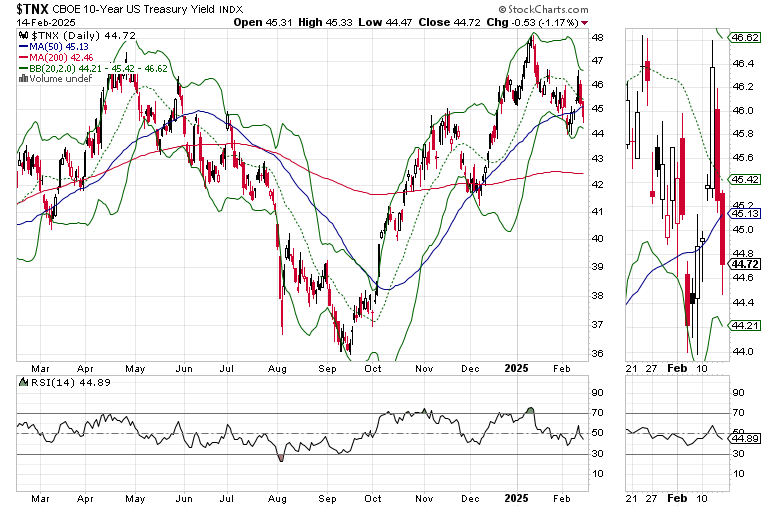
The bond market had a volatile week as the stronger than expected CPI pushed yields higher only to reverse after the PPI proved to be tamer than expected.
The U.S. Ten Year Note yield (TNX) broke below the important support area of 4.5% and its 50-day moving average. This is a bullish move, which could keep a floor under stocks.
Fear Remains High.
Here is the market’s current background:
• The CNN Greed/Fear Index (GF) reflects a fearful market, closing last week at 44, signaling persistent Fear. This is encouraging. Markets rarely descend into long term bear trends during periods of high fear.
• The Put/Call ratio has been rising lately, closing at 0.95 on Thursday before falling to 0.7 on Friday. The recent high for CPC was just above 1.0 in early 2025. The prior meaningful market bottoms, which led to long term rallies followed P/C ratios of 1.25 (8/24) and 1.30 (11/24). A sudden peak in this indicator could again signal a market bottom.
• The New York Stock Exchange Advance Decline line (NYAD, is flirting with a new high as the major indexes are starting to break out.
Bottom line: This is a bullish, albeit unnerving environment for stocks.
Money is Stealthily Moving Back into Growth
The rally is broadening, with growth stocks getting some money flowing back into them.
The SPDR S&P 500 Growth ETF (SPYG) is within striking distance of a new high. Note the rapidly rising ADI line as short sellers are scampering. The OBV line has stopped falling signaling that investors are starting to move back in.
The quiet return to the growth trade is also visible in the rebound for the FT Nasdaq Clean Edge ETF (GRID) where power infrastructure companies associated with AI data centers and related companies reside. GRID just crossed above its 50-day moving average reversing its recent decline. For more on ETF trading and investing, check out the Sector Selector Portfolio.
You can also see positive money flows back into the technology sector. The iShares Expanded Tech-Software ETF (IGV) is rebounding after finding support at its 50-day moving average. The ADI line is moving aggressively higher while the OBV line is bottoming out as money is moving back in.
Liquidity Remains Stable; Leans Toward Easy.
Liquidity, the ease with which money travels through the financial system is the key to bull and bear markets. When liquidity is ample, markets tend to rise. When liquidity is scarce markets don’t do well. The Federal Reserve’s National Financial Conditions Index (NFCI) is a readily available tool which indirectly shows us the state of liquidity in the markets.
A decline in the weekly NFCI number indicates that the ease with which money can be borrowed is rising. Last week, NFCI remained unchanged (-0.64). This remains a positive for stocks.
Something Big is Brewing in Bitcoin
Bitcoin (BTCUSD) seems to be on the verge of a big move as the Bollinger Bands (BB) are starting to squeeze toward the 20-day moving average. A move above the 20 and 50-day moving averages should set up a test of the $107-$109,000 overhead resistance.
BTC
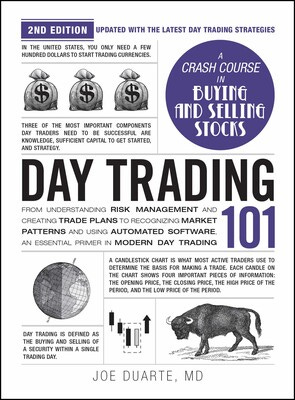
My latest Bitcoin trade in the ESP portfolio of the Smart Money Passport remains active. If you’re an ETF trader, consider, Joe Duarte’s Sector Selector. It’s FREE with your monthly membership to Buy Me a Coffee. Sign up here. If you’ve been thinking about starting a day trading career, my new book “Day Trading 101” will get you started on the right foot. For steady gainers, check out the Smart Money Weekender Portfolio. I’ve just added several new positions in this weekend’s edition. Cut your stress, lose weight, sleep better, and trade more effectively. Visit my Health Page.
NYAD Reverses After Approaching New Highs
The New York Stock Exchange Advance Decline line (NYAD) continues to hover just below its recent highs. A new high on NYAD could well signal that stock prices are about to move decidedly higher. The 50-day moving average remains a critical support level.
The Nasdaq 100 Index (NDX) made a new high on 2/14/25. Both the ADI and OBV are moving higher. The 20 and 50-day moving averages are short term support.
The S&P 500 (SPX) remains above 6000 level and is within reach of another new high. Both the 20 and the 50-day moving averages are also important support levels here.
VIX Falls Remains Below 20
The CBOE Volatility Index (VIX), remains below 20 – a positive.
VIX rises when traders buy large volumes of put options. Rising put option volume leads market makers to sell stock index futures to hedge their risk and leads markets lower. A fall in VIX is bullish signaling lower put option volume, eventually leads to call buying which is bullish as it causes market makers to buy stock index futures raising the odds of higher stock prices.
To get the latest up to date information on options trading, check out “Options Trading for Dummies”, now in its 4th Edition – Available Now!
#1 Best Seller in Options Trading – Now in Audible Audiobook Format
Options Trading for Dummies (4th Edition) Audible Audiobook – Unabridged
Joe Duarte MD (Author), Terrence Kidd (Narrator), Tantor Audio (Publisher)
4.5 out of 5 stars
#1 Best Seller in Options Trading


